How to analyze time series data for forecasting
TL;DR
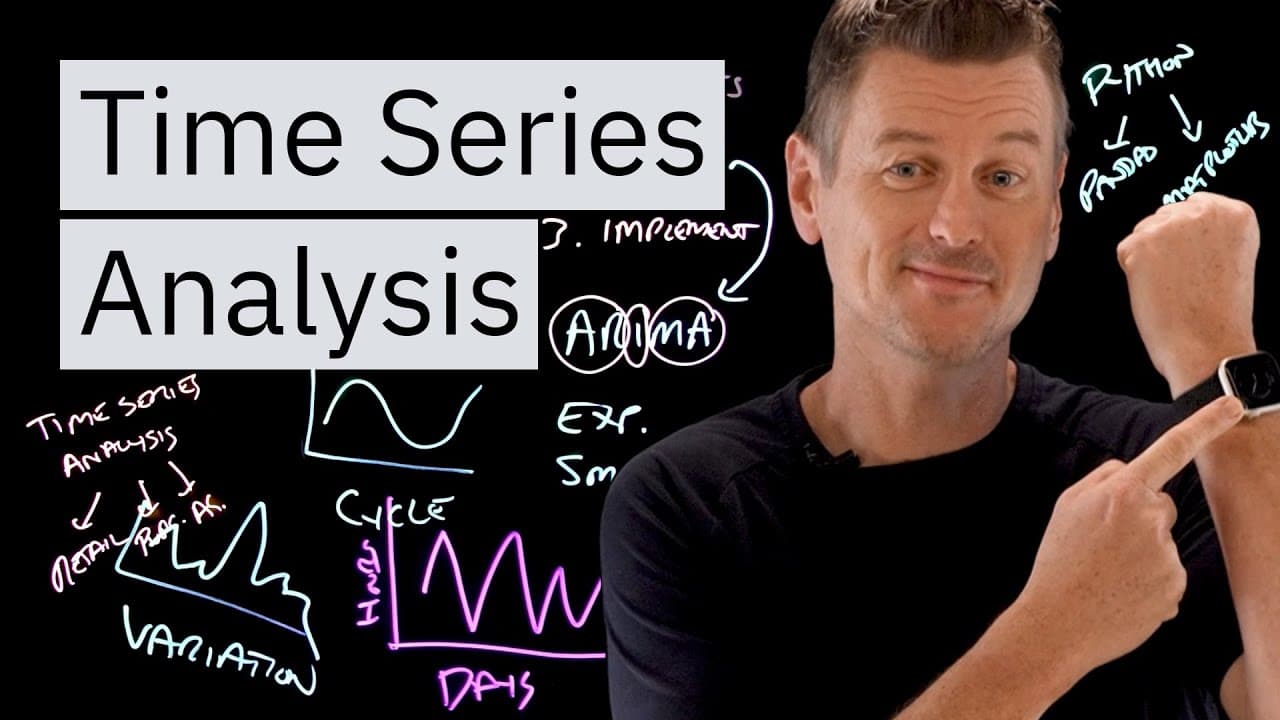
Time series analysis identifies trend, seasonality, cycle, and noise to forecast future values. Common models include ARIMA and exponential smoothing, chosen based on data patterns. Python tools like Pandas and Matplotlib help implement, clean data, visualize trends, and model results for informed decisions.
Transcript
My smartwatch tracks how much sleep I get each night. If I'm feeling curious, I can look at my phone and see my nightly slumber plotted on a graph. It might look something like this. And on the graph, on the y-axis, we have the hours of sleep. And then on the x-axis, we have days. And this is an example of a "time series". And what a time series is... Read More
Key Insights
- Time series data are collected at regular intervals and analyzed to extract meaningful patterns over time.
- A time series has four components: trend, seasonality, cycle, and variation, each describing different aspects of the data over time.
- The trend is the overall direction of the data, whether rising, falling, or staying flat.
- Seasonality is a repeating pattern within a fixed period, such as holiday spikes in sales.
- Cycle refers to non-seasonal, longer-term fluctuations like economic booms and busts.
- Variation, also called irregularity or noise, accounts for unpredictable ups and downs that are not explained by the other components.
- ARIMA is a popular forecasting model that combines Auto Regressive, Integrated, and Moving Average parts to forecast future values.
- Exponential smoothing forecasts time series data that lack clear trend or seasonality by weighting recent observations more heavily than older ones.
- Python libraries like Pandas help with data manipulation and analysis, while Matplotlib aids in visualizing time series data.
- More videos from this channel:
- More from this channel: IBM Technology
Install to Summarize YouTube Videos and Get Transcripts
Explore YouTube Video Summarizer or Get YouTube Transcript Extractor
Questions & Answers
Q: A real search query question about the video (e.g. 'How to...', 'What is...', 'Why does...', 'When should...'). Question 1
What is time series analysis and why is it useful for forecasting future values, and how do trend, seasonality, cycle, and variation contribute to the forecast? Time series analysis collects data at regular intervals to identify patterns that can be projected forward, enabling planning in business, agriculture, and purchasing decisions.
Q: Question 2
How do ARIMA models work and in what scenarios are they typically used for forecasting time series data, including its components Auto Regressive, Integrated, and Moving Average, and how do they help smooth out noise while capturing trends and seasonality when needed?
Q: Question 3
What is exponential smoothing and when is it preferred over ARIMA for time series forecasting, especially for data without clear trend or seasonality, and how does it assign more weight to recent observations to improve forecast accuracy?
Q: Question 4
What role do Python libraries Pandas and Matplotlib play in time series analysis, and how do they support data preprocessing, analysis, and visualization to help users understand trends and seasonality in their data?
Q: Question 5
How can time series forecasting impact business decisions like inventory optimization and purchasing, and what are practical steps to implement forecasts in a retail or agricultural context using the models mentioned? Forecasters should align model choice with data patterns.
Q: Question 6
What are the key components of a time series and how do they differ in meaning, such as the difference between a recurring seasonal pattern and a longer term cycle, and why is it important to separate these components before forecasting?
Q: Question 7
What are the common missteps when applying time series analysis, and how can practitioners ensure data quality, proper model selection, and appropriate visualization to avoid misleading forecasts?
Q: Question 8
How can you validate a time series forecast to ensure reliability, including methods for assessing model fit, forecasting accuracy, and understanding the impact of irregular variation on future predictions?
Summary & Key Takeaways
-
Time series analysis decomposes data into trend, seasonality, cycle, and variation to reveal underlying patterns and guide forecasts. It uses models like ARIMA and exponential smoothing, each suited to different data characteristics. Software tools such as Python libraries enable implementation and visualization.
-
Applying time series forecasting helps predict outcomes such as sales, weather, or prices, allowing better inventory, planning, and strategic decisions. The choice of model depends on whether there is trend, seasonality, or irregular variation in the data.
-
Implementation emphasizes using pandas for data handling and matplotlib for visualization to clean data, explore patterns, and communicate forecast results to stakeholders.
Read in Other Languages (beta)
Share This Summary 📚
Summarize YouTube Videos and Get Video Transcripts with 1-Click
Try YouTube Summary with ChatGPT & Claude or YouTube Transcript Generator
Explore More Summaries from IBM Technology 📚

Summarize YouTube Videos and Get Video Transcripts with 1-Click
Try YouTube Summary with ChatGPT & Claude or YouTube Transcript Generator