Why Does a Booming Economy Feel So Unequal?
TL;DR
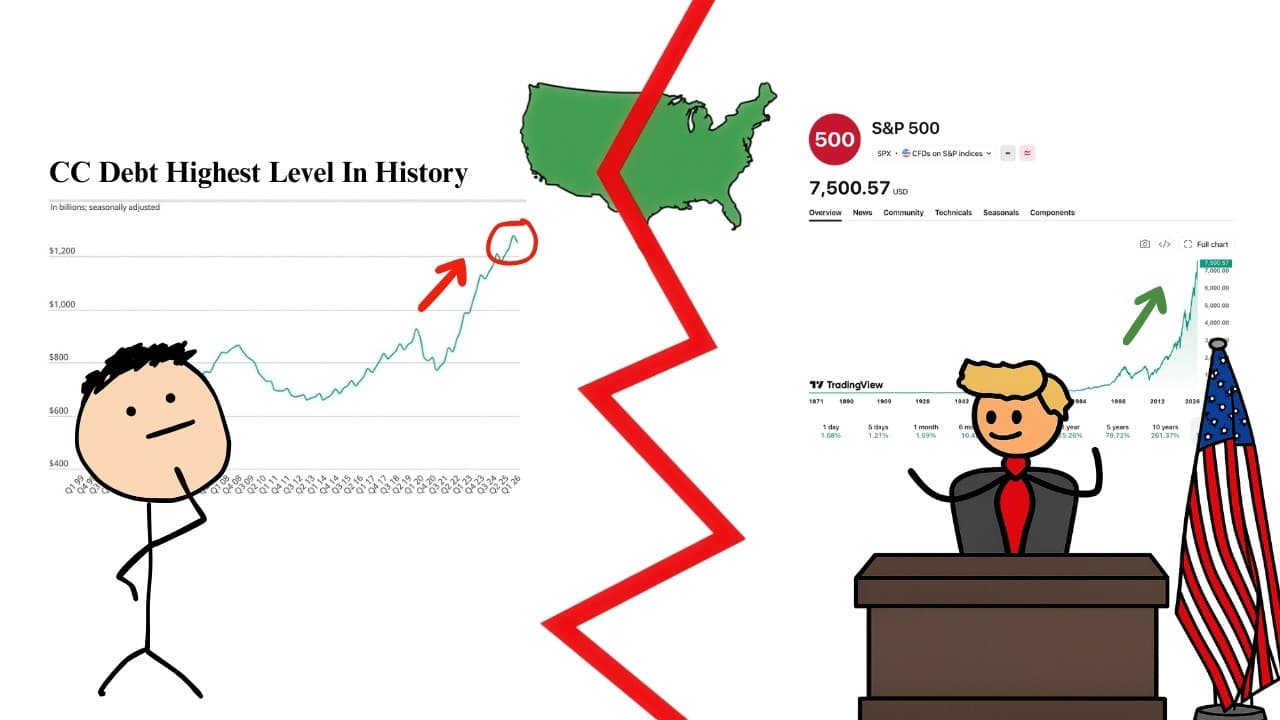
Record asset prices mainly reward households that already own substantial stocks, while millions of other Americans face living costs rising faster than earnings. Consumer spending remains resilient partly because households are using credit cards, buy now, pay later loans, retirement withdrawals, and savings to cover necessities, creating sharply different economic realities within the same country.
Transcript
The stock market just hit its 23rd record high this year. Home prices are higher than ever before and net worth in America has never been larger. By the numbers, this is one of the richest moments in the history of the country. But at the same time, consumer sentiment toward the economy has fallen to its lowest level ever recorded. It's lower than ... Read More
Key Insights
- The economic boom is concentrated in asset values, with the stock market reaching its 23rd record high of the year while home prices, national net worth, and the average 401(k) balance also reached record levels.
- Consumer sentiment has fallen to its lowest recorded level despite strong headline indicators, dropping below levels seen during the early 1980s recession, the 2008 global financial crisis, and the pandemic lockdowns.
- Stock ownership is highly concentrated, with the richest 1% of households owning more than half of US stocks and the wealthiest 10% owning roughly 87%, leaving the bottom 90% with only 13%.
- Stock market participation does not guarantee meaningful gains, because the bottom half has median stock holdings of about $13,000 while the top 10% holds around $600,000, representing a 48-fold difference.
- Living costs are outpacing earnings in the period cited, with average hourly earnings rising about 3.6% from a year earlier while inflation increased 3.8%, leaving the average worker behind before spending begins.
- Survival debt is borrowing used to cover ordinary necessities, with 33% of credit card debt holders citing day-to-day expenses as the main source of their balances and 61% carrying debt for at least a year.
- Buy now, pay later financing is increasingly used for essentials, with more than 90 million Americans using it, over a quarter of users applying it to groceries, and more than half saying they could not make ends meet without it.
- Household savings are deteriorating, with the personal savings rate falling to about 2.6% from 5.5% a year earlier and the bottom half of households collectively spending more than their after-tax income each month.
Install to Summarize YouTube Videos and Get Transcripts
Explore YouTube Video Summarizer or Get YouTube Transcript Extractor
Questions & Answers
Q: Why can the economy look strong while consumers feel worse?
The headline indicators and household experiences measure different parts of the economy. Record stock prices, home values, net worth, and retirement balances show that assets are appreciating. Those gains flow disproportionately to households that own substantial assets. Meanwhile, many other households face living costs rising faster than earnings, depleted savings, expensive debt, and growing difficulty paying for everyday necessities.
Q: Who benefits most when the stock market reaches record highs?
The wealthiest households benefit most because they own most of the market. The richest 1% of roughly 134 million US households own more than half of all stocks, while the top 10% own about 87%. The bottom 90% share the remaining 13%, and the bottom half, approximately 67 million households, collectively owns only 1% of the market.
Q: Does widespread stock ownership make market gains broadly shared?
Widespread participation does not make the gains equal. An estimated 58% of Americans own some stock, often through a 401(k), but the amount owned varies dramatically. Median holdings are about $13,000 for the bottom half and around $600,000 for the top 10%. That 48-fold difference means identical percentage returns produce radically different dollar gains.
Q: How does the same stock market return affect rich and lower-wealth households?
A percentage return rewards investors according to how much they already own. Using the video's figures, a roughly 16% market return in 2025 produced a paper gain of about $2,000 for the bottom half, based on median holdings near $13,000. For the top 10%, median holdings around $600,000 generated approximately $96,000 from that same return.
Q: Why are Americans withdrawing money from retirement accounts early?
A record number of people cashed out retirement savings early even as the average 401(k) balance exceeded $160,000. About 6% of savers made hardship withdrawals, roughly triple the pre-pandemic rate. Among those withdrawals, 36% were intended to prevent foreclosure or eviction, 31% addressed medical expenses, and 13% covered tuition-related costs.
Q: How is consumer spending continuing when household finances are strained?
Some spending is being funded through debt, reduced savings, and retirement withdrawals rather than stronger purchasing power. Average hourly earnings rose about 3.6% from a year earlier while inflation increased 3.8%. Credit card debt reached about $1.25 trillion, and growing use of buy now, pay later loans allows households to postpone payment for everyday purchases.
Q: What is survival debt and why is it difficult to escape?
Survival debt is borrowing used to pay day-to-day expenses rather than discretionary purchases. Among people carrying credit card debt, 33% identified everyday expenses as its primary source. With average credit card interest rates around 23%, balances can persist and become expensive. Bankrate found that 61% of borrowers with credit card debt had carried it for at least a year.
Q: What do falling savings rates reveal about household finances?
Falling savings rates indicate that households have less capacity to absorb emergencies or rising costs. The personal savings rate dropped to about 2.6%, near its lowest recorded level, from 5.5% a year earlier. For the bottom half of the country, representing more than 65 million households, the savings rate is negative, meaning spending exceeds after-tax income each month.
Summary & Key Takeaways
-
Economic headlines show record stock prices, home values, household net worth, and average 401(k) balances. Consumer sentiment, however, has fallen to its lowest recorded level. The apparent contradiction reflects the unequal distribution of asset ownership, because market gains primarily flow to households that already hold large stock portfolios.
-
The richest 1% of households own more than half of US stocks, while the top 10% own roughly 87%. The bottom half owns just 1% in total. Consequently, an identical market return produces vastly different dollar gains, widening the gap between households with substantial assets and everyone else.
-
Many households are maintaining consumption by drawing upon future income and emergency resources. Credit card balances have reached about $1.25 trillion, buy now, pay later loans increasingly finance groceries, and the personal savings rate has fallen to about 2.6%. For the bottom half of households, the savings rate is negative.
Read in Other Languages (beta)
Share This Summary 📚
Summarize YouTube Videos and Get Video Transcripts with 1-Click
Try YouTube Summary with ChatGPT & Claude or YouTube Transcript Generator
Explore More Summaries from Casual Finance 📚



Summarize YouTube Videos and Get Video Transcripts with 1-Click
Try YouTube Summary with ChatGPT & Claude or YouTube Transcript Generator