How to build a live finance dashboard with Claude
TL;DR
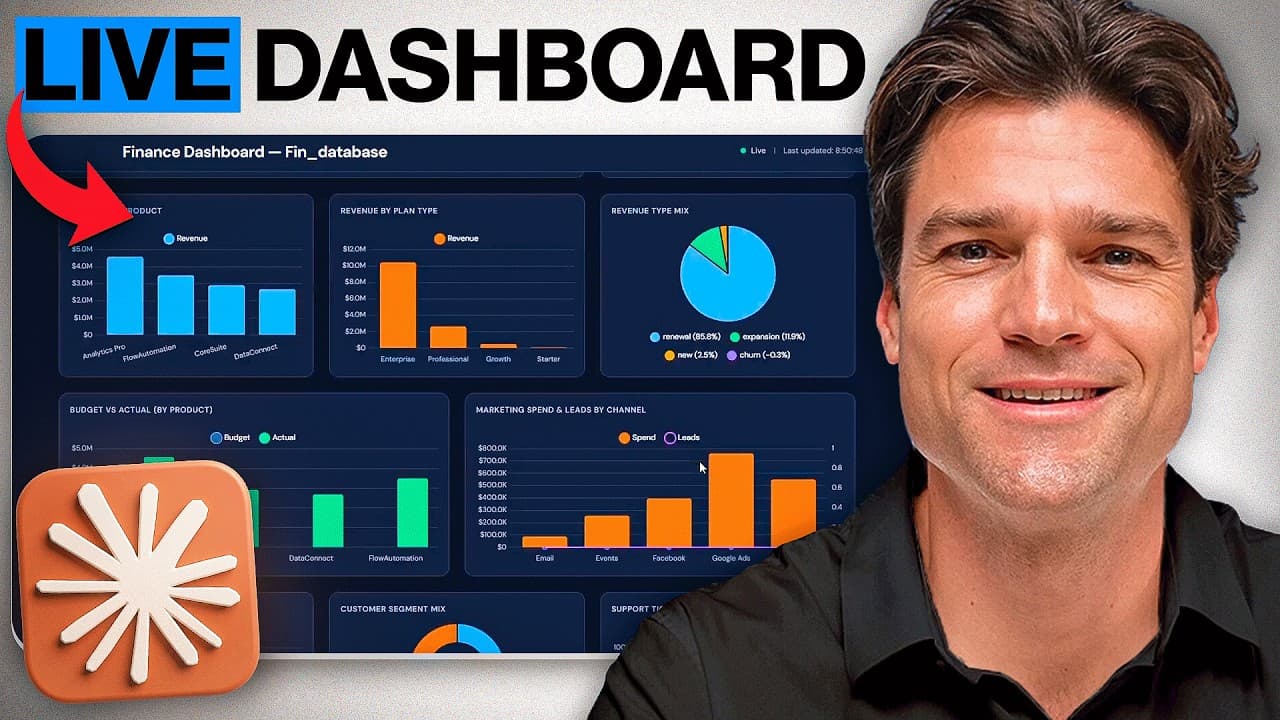
A live finance dashboard is created by connecting Google Sheets to Claude using an API key and a seven-tab data model. The system is designed to auto refresh every 30 seconds and be deployed on a real domain via Hostinger Horizons, enabling real team access without manual coding. The workflow covers data structure, API setup, prompt-driven design, and production deployment.
Transcript
In this video, I'm going to show you how you can build a financial dashboard connected to your live data, refreshing itself every 30 seconds, running on a real domain that anyone on your team can open while keeping the costs low. Because building a financial dashboard with Claude that looks good is really not that difficult anymore. But the problem... Read More
Key Insights
- X shows a live dashboard can auto refresh using a 30 second cycle, connecting seven Google Sheets tabs through an API so data stays current.
- The key to a usable dashboard is modeling data across multiple functional tabs rather than a single flat table, mirroring real SAS company operations.
- The system uses Claude Opus 4.7 to plan across inputs and generate a transferable blueprint of prompts for an AI dashboard builder.
- L Horizons is used to build and deploy the UI, while Claude designs the data logic and prompts, enabling a code-free production workflow.
- The data layer is secured by enabling the Google Sheets API and sharing the sheet with view access to let Claude read data.
- A live domain solution is achieved by hosting the app on Hostinger Horizons, providing hosting, domain, and the builder in one place.
- The workflow emphasizes maintaining a consistent data model and updating prompts as needed to match analytical framing.
- The final dashboard includes eight KPIs, ten charts, two live tables, and is connected to real data, with a live status indicator and last updated timestamp.
- More videos from this channel:
- More from this channel: Luke Finance
Install to Summarize YouTube Videos and Get Transcripts
Explore YouTube Video Summarizer or Get YouTube Transcript Extractor
Questions & Answers
Q: How does the dashboard stay up to date with new data from Google Sheets?
The dashboard uses a 30 second refresh cycle that fetches data from seven Google Sheets tabs in parallel, cleans the raw formats, and updates all KPIs, charts, and tables. If a fetch fails, it shows a green live indicator when successful and a red indicator on failure, while preserving the last valid state for usability.
Q: What role does Claude play in this workflow?
Claude acts as the system designer and planner. It analyzes the seven tab data, decides on KPIs and charts, and breaks the build into step-by-step prompts for an AI dashboard tool. It also generates real API endpoints so the dashboard can pull live data and guides the UI structure and behavior through prompts.
Q: How is the data made accessible to Claude for design decisions?
The data is stored in a Google Sheets file with seven interconnected tabs, representing raw transactions, customers, sales pipeline, marketing spends, cogs, budgets, forecasts, and support operations. Claude is given the sheet link and an API key so it can access and read the data to inform design decisions.
Q: What is Horizon's role in the deployment process?
Hostinger Horizons builds and deploys the UI described by Claude. It can generate a production-ready React app with Tailwind styling, connect it to the live Google Sheets data, and host it on a real domain, providing hosting, a domain, and the full builder in one place.
Q: What changes after wiring the live data layer in Horizons?
After wiring the live data layer, the dashboard begins to pull data directly from Google Sheets instead of showing static values. KPIs recalculate on each cycle, charts refresh with new data, and the header displays a live indicator with the last updated timestamp.
Q: How many KPIs and charts are included in the final dashboard?
The final dashboard features eight KPI cards, ten integrated charts, and two live tables. Everything is tied to real data across revenue, costs, pipeline, marketing, customers, and support, providing a comprehensive production-grade financial view.
Q: Why is the workflow described as transferable and deployable to any platform?
Claude generates a structured markdown document that breaks the dashboard into ten sequential prompts, which can be pasted into any AI dashboard tool builder. Horizons then implements those prompts in its own React and Tailwind stack, allowing the same design and logic to be deployed without rewriting core pieces.
Q: What applies to the live domain and sharing capabilities for the finance dashboard?
The system is designed to be hosted on a real domain accessible to the entire finance team. Horizons handles hosting and deployment, enabling shareable access, live auto-refresh, and continuous reporting without the need for manual server setup, making collaboration straightforward.
Summary & Key Takeaways
-
A workflow is described to turn raw company data into a live finance dashboard that updates every 30 seconds, leveraging Claude for design and Hostinger Horizons for deployment, with Google Sheets as the data source.
-
A multi-tab data model is used to reflect real business operations, and an API connection is established so Claude can design and Horizon can deploy a live, shareable dashboard.
-
The tutorial covers prompts that define layout, data connections, KPI logic, charts, tables, and UI polish, culminating in a production-ready dashboard on a real domain with live data.
Read in Other Languages (beta)
Share This Summary 📚
Summarize YouTube Videos and Get Video Transcripts with 1-Click
Try YouTube Summary with ChatGPT & Claude or YouTube Transcript Generator
Explore More Summaries from Luke Finance 📚



Summarize YouTube Videos and Get Video Transcripts with 1-Click
Try YouTube Summary with ChatGPT & Claude or YouTube Transcript Generator