How to Build Four Finance Deliverables with Claude
TL;DR
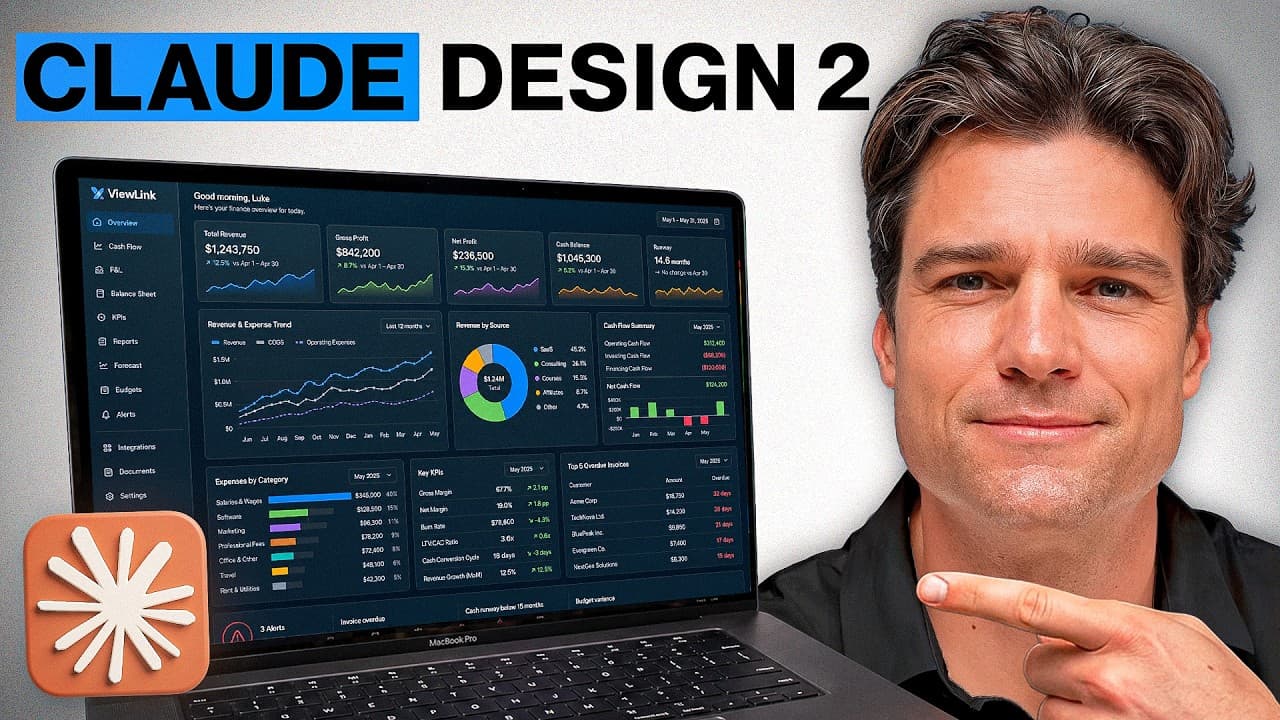
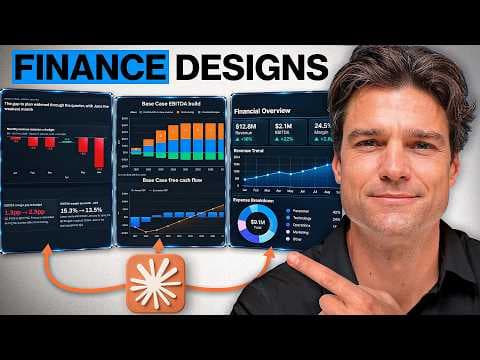
A single project folder and company design system can feed a financial report, board deck, interactive FP&A dashboard, and scenario planning studio. Claude Design 2 reads shared financial data and context, applies consistent branding, creates editable visuals, checks outputs for errors, and lets assumption changes flow through projections for revenue, EBITDA, cash flow, debt, and runway.
Transcript
Claude Design 2 just dropped and the biggest change for finance is how much you can build from a single starting point. You set up one project folder in one company design system and from there the same source feeds a document, a deck, a dashboard and a planning tool that all look and behave like they came from the same place. Now before this, ever... Read More
Key Insights
- A centralized project folder is the shared source for monthly financials, budget-versus-actual results, business unit and regional performance, operational KPIs, planning assumptions, executive notes, and company context used across all four finance deliverables.
- A company design system stores colors, typography, spacing, and reusable components once, allowing financial reports, board presentations, dashboards, and planning applications to maintain the same visual identity without rebuilding the brand for each output.
- The financial reporting workflow begins with clarification questions about the reporting period, document length, imagery level, and which source takes precedence when spreadsheets and executive commentary conflict, turning an open prompt into a specific publishing brief.
- Higgsfield generates six report-specific images in parallel, including renewable infrastructure, wind farm, battery storage, and grid visuals. Consistent cool-toned navy grading helps the imagery match the Nova Energy design system and support individual report sections.
- Claude preserves financial accuracy when a requested visualization is unsupported by the data. When operating cash flow, capital expenditure, and free cash flow did not reconcile into a clean waterfall, it presented them as separate reported metrics and explained the decision.
- The board presentation contains 14 slides covering financial performance, business segments, regional results, cash flow, capital allocation, operations, risks, and outlook. Its figures include $887 million in revenue, 5.9% growth, a 28.2% EBITDA margin, and $212 million in free cash flow.
- The presentation validation process renders slides, identifies layout defects, corrects text wrapping on an operations slide and within a risk label, and checks the deck again. Animations guide attention through counting KPI cards, building charts, and sequential waterfall components.
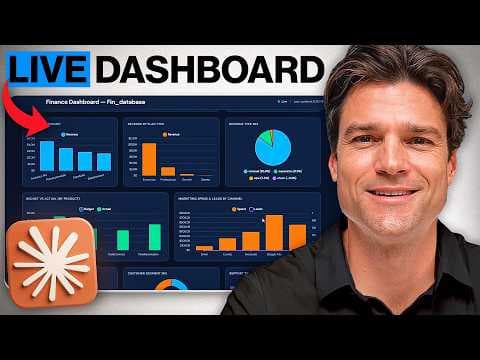
- The interactive finance applications use consolidated data from the same project folder. The FP&A command center supports global filters and drill-down from KPIs to segments, months, and line items, while the scenario studio updates revenue, EBITDA, cash flow, debt, and runway when assumptions move.
- More videos from this channel:
- More from this channel: Luke Finance
Install to Summarize YouTube Videos and Get Transcripts
Explore YouTube Video Summarizer or Get YouTube Transcript Extractor
Questions & Answers
Q: How can one data source produce multiple finance deliverables?
Claude Design 2 can connect one centralized project folder to several output templates. The folder contains monthly financials, budget-versus-actual information, business unit and regional performance, operational KPIs, planning assumptions, executive notes, and a company profile. Claude reads that common source, then uses it to create a report, board presentation, FP&A dashboard, and scenario planning studio without requiring the underlying context to be rebuilt for each deliverable.
Q: What should a finance project folder contain for Claude Design 2?
The demonstrated project folder contains the material an FP&A team uses in its normal work: monthly financials, budget-versus-actual results, business unit performance, regional performance, operational KPIs, and planning assumptions. It also includes executive notes and a company profile. Those narrative files give Claude context about the business and the story behind the figures, rather than limiting its analysis to spreadsheet values alone.
Q: How does a design system improve finance reporting?
A design system stores the company's colors, typography, spacing rules, layouts, and reusable components in one place. Claude applies those elements across the report, slide deck, dashboard, and planning tool. In the Nova Energy example, this shared system keeps all four builds visually consistent, including navy header bands, KPI layouts, tables, maps, and other components, without recreating branding for every new finance output.
Q: How does Claude handle conflicting financial sources?
Claude asks which source should take precedence when executive commentary and spreadsheets disagree, preventing two versions of the same figure from being blended. It also evaluates internal consistency. In the board deck workflow, it found an older full-year 2024 figure in the company profile that used a different scale from the full-year 2025 model, so it relied on the internally consistent figures instead of using the conflicting value.
Q: How are AI-generated visuals integrated into the financial report?
Higgsfield is connected as the report's visual layer and generates six images in parallel for the specific company, sections, and design system. The set includes renewable infrastructure, wind farms, battery storage, and grid imagery with consistent cool-toned navy grading. Claude then places the visuals within the document. It also inserted three regional maps into existing cards without disrupting the surrounding text or layout.
Q: How does Claude avoid misleading financial charts?
Claude checks whether the available figures support the intended visualization instead of forcing every metric into a preferred chart. During the cash flow section, operating cash flow, capital expenditure, and free cash flow did not reconcile into a clean waterfall. Claude therefore displayed the three values as separate reported metrics and explained the choice, preserving the stated figures rather than manufacturing a reconciliation unsupported by the source data.
Q: What does the board presentation workflow create and validate?
The workflow creates a 14-slide, board-ready presentation covering the title, agenda, executive summary, financial performance, segments, regions, cash flow, capital allocation, operations, risks, and full-year 2025 outlook. Claude plans the structure, builds the deck, renders it, detects layout problems, fixes text wrapping on an operations slide and a risk label, and then repeats the validation check before completing the presentation.
Q: How do the FP&A dashboard and scenario planning studio work?
The FP&A command center consolidates information from the project folder into one data model, so its KPIs, charts, filters, and interactive views use the same source. Analysts can drill from a KPI into a segment, month, and line item. The scenario planning studio provides a live planning environment where changing one business assumption updates projected revenue, EBITDA, cash flow, debt, and runway in real time.
Summary & Key Takeaways
-
Claude Design 2 uses one centralized project folder containing monthly financials, budget-versus-actual results, business unit and regional performance, operational KPIs, planning assumptions, executive notes, and a company profile. A reusable design system supplies colors, typography, spacing, layouts, and components across every output, eliminating repeated setup work.
-
The reporting workflow produces a publication-ready, ten-section full-year 2025 financial report with executive commentary, editable charts, consistent financial tables, and tailored Higgsfield imagery. Claude asks clarifying questions about scope, detail, imagery, and source precedence before building, then preserves accuracy when figures cannot be reconciled into a clean visualization.
-
The same source material also produces a validated 14-slide board deck, an interactive FP&A command center, and a scenario planning studio. These outputs support professional animations, shared data models, global filtering, detailed drill-down, and real-time updates to revenue, EBITDA, cash flow, debt, and runway when business assumptions change.
Read in Other Languages (beta)
Share This Summary 📚
Summarize YouTube Videos and Get Video Transcripts with 1-Click
Try YouTube Summary with ChatGPT & Claude or YouTube Transcript Generator
Explore More Summaries from Luke Finance 📚


Summarize YouTube Videos and Get Video Transcripts with 1-Click
Try YouTube Summary with ChatGPT & Claude or YouTube Transcript Generator