How to Scale Facebook Ads Without Losing Money
TL;DR
Scale Facebook ads without losing money by calculating an exact blended return target from revenue, variable costs, fixed costs, and the profit you want to retain. In the example, a 1.68 blended return permits about $143,000 in ad spend at break-even, while reserving 10% profit raises the target to 2.02. Read on to compare both models and decide when to raise or reduce spending.
Transcript
Did you know that there's actually a better way to run your Facebook ads that successful scaling brands all do? I'm talking about a simple tracking setup that I personally use to make sure that I never go unprofitable on any given month. This method also ensures that I squeeze as much as possible out of Facebook so that I acquire as many new custom... Read More
Key Insights
- A blended return target is calculated from total business revenue and advertising spend across every platform, rather than from one campaign or channel. This business-level measurement connects advertising decisions directly to variable costs, fixed costs, desired profit, and the company’s ability to remain financially sustainable.
- A reliable monthly forecast uses average orders and average order value from the previous three to six months while excluding exceptional sales periods such as Black Friday. Removing unusual peaks produces a more realistic baseline for estimating current-month revenue and determining how much advertising spend the business can support.
- Variable operating costs should include all costs that rise with sales, and the estimate should be rounded upward to provide a safety margin. In the example, the underlying percentage is roughly 33.5%, but the model uses 35% so that advertising limits are based on conservative assumptions.
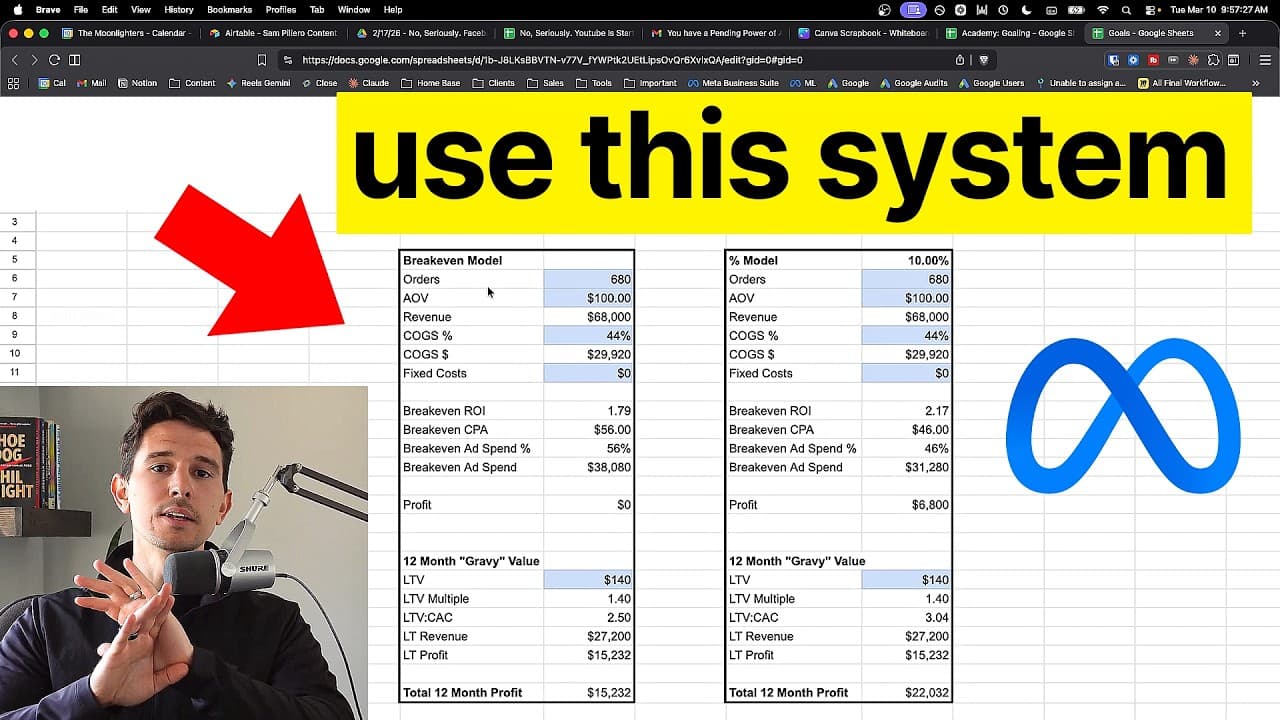
- The break-even model allocates all money remaining after variable and fixed costs to advertising. For the example business, a 1.68 blended return, approximately $61 break-even acquisition cost, and roughly $143,000 in advertising spend would produce no first-purchase profit while maximizing customer acquisition.
- A 12-month lifetime value estimate captures revenue that arrives after the initial purchase. The example customer has a $103 initial average order value and a $128 lifetime value, creating a 1.24 multiple and an LTV-to-CAC ratio of two, with projected 12-month profit of about $38,000.
- A percentage model protects a selected current profit margin by reducing the amount available for advertising. Reserving 10% of the example’s revenue creates about $24,205 in immediate profit, raises the required blended return from 1.68 to 2.02, and lowers the allowable acquisition cost to about $50.90.
- Higher immediate profit can reduce total customer acquisition and future profit. Cutting approximately $23,000 in advertising at an assumed $60 acquisition cost removes about 383 potential orders, which then lowers revenue, immediate profit, and projected 12-month profit within the model’s linear scenario.
- A precise return target guides whether spending should increase or decrease. When actual return exceeds the target, the business may be leaving potential customers unacquired and should spend more. When return falls below the target, it should reduce spending and improve efficiency instead of making premature campaign decisions.
Install to Summarize YouTube Videos and Get Transcripts
Explore YouTube Video Summarizer or Get YouTube Transcript Extractor
Questions & Answers
Q: How do you calculate a break-even Facebook ads target?
Estimate revenue from expected orders and average order value, then subtract variable operating costs and fixed costs. The remainder is the maximum break-even advertising budget. Divide revenue by that budget to calculate the required blended return, and use order volume to convert the limit into a break-even acquisition cost.
Q: What data should you use to forecast monthly advertising capacity?
Use average order volume and average order value from the previous three to six months. Exclude unusually large sales periods such as Black Friday so they do not distort an ordinary month’s forecast. This creates a realistic revenue baseline for calculating costs and allowable ad spend.
Q: Which costs belong in the variable cost percentage?
Include all operating expenses that rise with sales, not only direct product costs. Use a conservative estimate by rounding the percentage upward. The example rounds an actual figure of about 33.5% to 35% to provide room for error.
Q: Why would a brand break even on first purchases?
A break-even model reinvests all money remaining after variable and fixed costs into acquiring customers. Although it produces no first-purchase profit, later purchases can generate profit over the following 12 months. In the example, the model projects about $38,000 in 12-month profit.
Q: How does reserving 10% profit change Facebook ad targets?
The percentage model reserves the chosen profit before calculating the available advertising budget. In the example, reserving 10% produces about $24,205 in immediate profit. It raises the required blended return from 1.68 to 2.02 and lowers the allowable acquisition cost from about $61 to approximately $50.90.
Q: How can taking more immediate profit slow growth?
Keeping more current profit leaves less money available for advertising and customer acquisition. In the example, moving to the 10% profit model cuts roughly $23,000 in advertising. At an assumed $60 acquisition cost, that represents about 383 potential orders.
Q: How should 12-month lifetime value affect the advertising model?
Compare the 12-month lifetime value with the initial average order value and acquisition cost to estimate revenue after the first purchase. The example uses a $128 lifetime value and a $103 initial order value, producing a 1.24 multiple and a 12-month LTV-to-CAC ratio of two. The model does not look beyond 12 months unless the business has substantial financial capacity.
Q: When should a brand increase or reduce Facebook ad spend?
Increase spending when the actual blended return exceeds the exact target, because the business may be able to acquire more customers while remaining within its financial limits. Reduce spending and improve efficiency when the return falls below the target. Blended return should include total revenue and advertising spend across all platforms.
Summary & Key Takeaways
-
The tracking method begins with average orders and order value from the previous three to six months, excluding unusually large sale periods. Revenue, conservatively rounded variable operating costs, and fixed costs are combined to calculate the money available for advertising, along with the blended return, acquisition cost, and ad-spend limits.
-
A break-even model reinvests all available first-purchase profit into customer acquisition. In the example, 2,350 orders at a $103 average order value produce roughly $242,050 in revenue. With variable costs at 35% and fixed costs near $13,000, the business can spend about $143,000 while targeting a 1.68 blended return.
-
A percentage model reserves a chosen share of revenue as current profit and therefore requires greater advertising efficiency. Reserving 10% raises the example target from 1.68 to 2.02 and reduces available ad spend. The tradeoff is fewer acquired customers, potentially lower future revenue, and reduced 12-month profit if order volume falls accordingly.
Read in Other Languages (beta)
Share This Summary 📚
Summarize YouTube Videos and Get Video Transcripts with 1-Click
Try YouTube Summary with ChatGPT & Claude or YouTube Transcript Generator
Explore More Summaries from Sam Piliero 📚
Summarize YouTube Videos and Get Video Transcripts with 1-Click
Try YouTube Summary with ChatGPT & Claude or YouTube Transcript Generator