How does the ECG basics explain the P wave to T wave process?
TL;DR
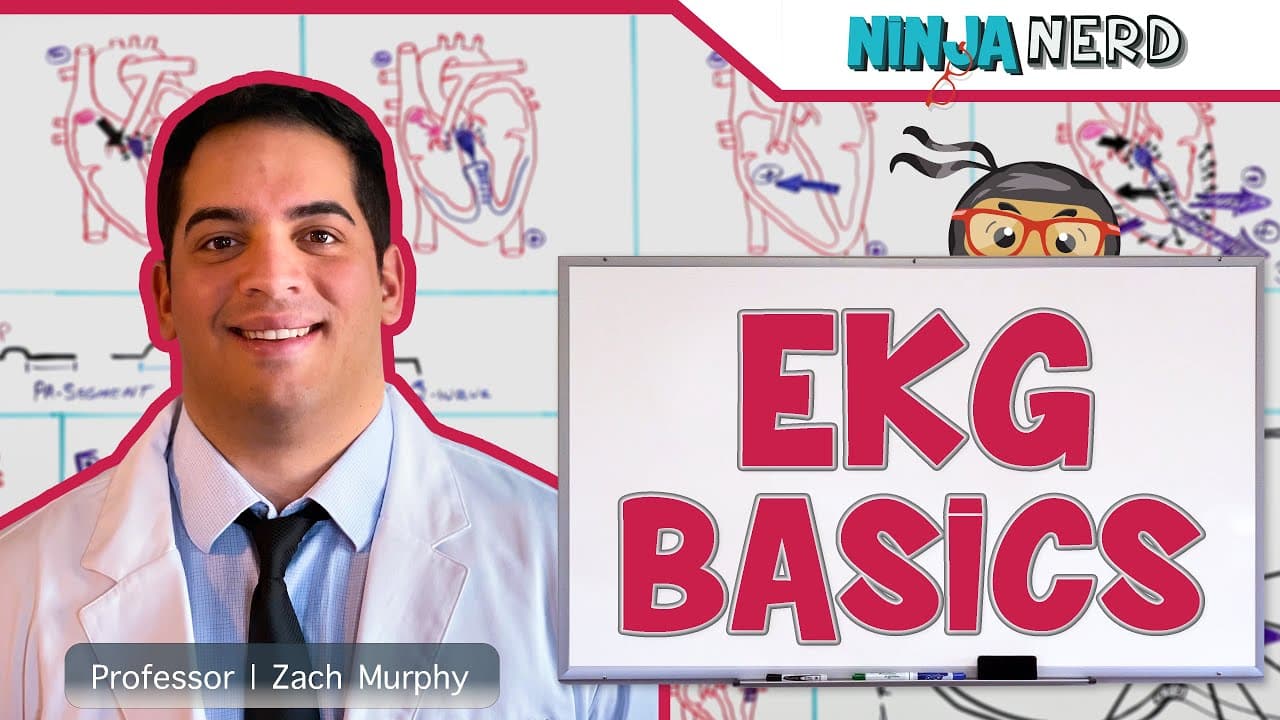
The video explains that the ECG converts electrical activity of the heart into graphic deflections on leads. The P wave marks atrial depolarization, followed by a PR interval during slow conduction in the AV node. Lead II is used to illustrate how vectors create positive and negative deflections that represent each wave phase.
Transcript
All right, engineers. So, what we're going to do in this video is we're going to talk about the basics of EKG. This is a really important diagnostic tool that we should use as clinicians. It's important for being able to look for arhythmias, being able to look for possible myioardial inffections. So, it's a great tool that we as clinicians should b... Read More
Key Insights
- The ECG is a graphical representation of electrical activity using electrodes and leads.
- The P wave on the ECG represents atrial depolarization.
- The PR interval reflects slow conduction through the AV node before ventricular activation.
- Lead II is used to illustrate how vectors influence deflections on an ECG trace.
- A positive deflection occurs when activity moves toward the positive electrode.
- A negative deflection occurs when activity moves away from the positive electrode.
- Isoelectric periods occur when there is no net electrical movement, such as during AV delay.
- Understanding lead orientation helps interpret which cardiac regions are being monitored.
Install to Summarize YouTube Videos and Get Transcripts
Explore YouTube Video Summarizer or Get YouTube Transcript Extractor
Questions & Answers
Q: What is the P wave and what does it indicate on an ECG?
The P wave represents atrial depolarization, showing the electrical activity as it moves from the SA node through the atria. In Lead II, when the atrial activity moves toward the positive electrode, you see a positive deflection corresponding to the P wave. This waveform marks the beginning of the ECG timeline and signals atrial activation. The existence and shape of the P wave help identify atrial activity and set up the subsequent intervals for analysis.
Q: What does the PR interval tell us in ECG interpretation?
The PR interval is the period during which the AV node conducts the impulse slowly before delivering it to the ventricles. It is observed as an isoelectric line between the P wave and the QRS complex because there is no net movement of electrical activity during AV nodal delay. Clinically, a prolonged PR interval can indicate AV nodal conduction delay and is central to assessing blocks and conduction integrity.
Q: Why is Lead II used in the example of ECG interpretation in the video?
Lead II provides a straightforward view of the heart’s electrical axis from the apex to the base, making it a useful reference for illustrating how vectors translate into positive or negative deflections. By using Lead II, the instructor demonstrates how atrial depolarization and subsequent ventricular activation are captured as distinct waves, helping learners relate anatomical directions to observable ECG patterns.
Q: What does a positive deflection indicate in this ECG context?
A positive deflection occurs when the electrical activity moves toward the positive electrode of the lead being used. In the example, movement toward the positive electrode produces a positive P wave, signifying atrial depolarization. This concept helps identify the direction of electrical propagation and the corresponding waveform on the ECG trace.
Q: What does a negative deflection indicate in this ECG context?
A negative deflection occurs when the electrical activity moves away from the positive electrode. In the lead example, if the activity moves away, the deflection on the ECG trace becomes negative, providing information about the direction of propagation relative to the lead orientation and aiding in interpreting different cardiac vectors.
Q: What is the significance of an isoelectric line on an ECG tracing?
An isoelectric line indicates a period with no net electrical movement in the monitored lead. This can occur during AV nodal delay or when there is no propagation in a given direction. It provides a baseline and helps distinguish between different phases of the cardiac cycle, such as the transition from atrial to ventricular activity.
Q: How does the video relate electrodes to the ECG output?
The video explains that electrodes pick up electrical activity generated by cardiac tissue. The relative movement of this activity toward or away from the positive electrode determines whether the deflection is positive or negative. This relationship forms the basis for interpreting waves, intervals, and segments on the ECG.
Q: What foundational concepts does this video aim to establish for future ECG topics?
The video establishes how the cardiac conduction system creates vectors that are translated into leads on the ECG. It covers the P wave, PR interval, and lead II interpretation, forming a base for recognizing normal intervals, rhythm, and later topics such as arrhythmias, ischemia, and different conduction blocks. This foundation is essential for advanced ECG analysis.
Summary & Key Takeaways
-
The ECG translates cardiac electrical activity into graphical deflections and intervals, with a focus on how electrode placement and lead selection affect the reading. The P wave corresponds to atrial depolarization, the PR interval to AV nodal delay, and subsequent waves reflect ventricular activity as the signal travels through the conduction system. The video emphasizes lead II as a representative view and reinforces foundational concepts for normal intervals and rhythm.
-
The instructor explains how vectors from the SA node to the AV node form the net direction seen by Lead II, producing a positive P wave. He then describes the isoelectric PR segment during AV nodal delay, followed by the ventricular activation sequence that yields QRS deflections.
-
By building from simple electrode behavior to lead II interpretation, the video establishes a framework for recognizing normal ECG components and paves the way for understanding arrhythmias, ischemia, and blocks in later topics.
Read in Other Languages (beta)
Share This Summary 📚
Summarize YouTube Videos and Get Video Transcripts with 1-Click
Try YouTube Summary with ChatGPT & Claude or YouTube Transcript Generator
Explore More Summaries from Ninja Nerd 📚




Summarize YouTube Videos and Get Video Transcripts with 1-Click
Try YouTube Summary with ChatGPT & Claude or YouTube Transcript Generator