How to Differentiate High and Low Resistance Liquidity
TL;DR
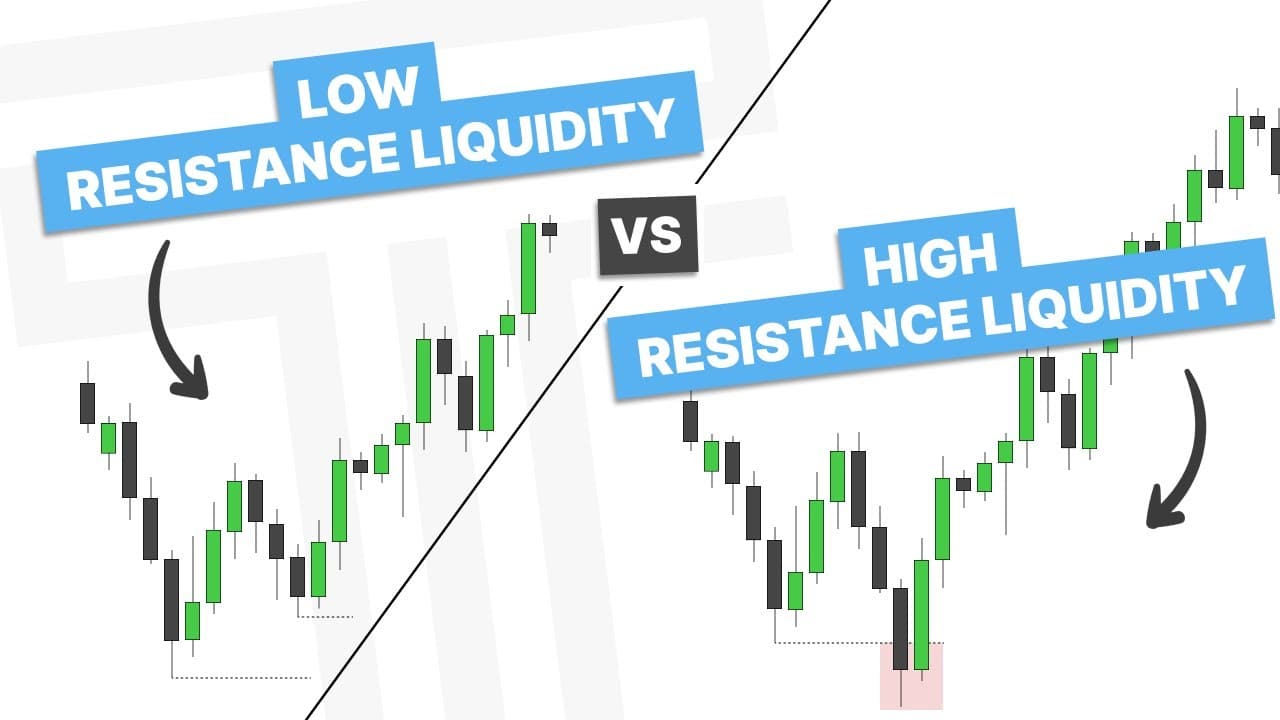
Understanding high and low resistance liquidity is crucial for traders. Low resistance liquidity involves failure swings where highs or lows aren't swept before a reversal, while high resistance involves sweeping them first. Traders can use high resistance for stop losses and target low resistance liquidity for potential entries.
Transcript
how's it going everyone this video is going to be over the differences between low resistance liquidity and high resistance liquidity let's hop into the PDF before we go into the charts for some examples so to understand the differences between High Resistance and low resistance liquidity you have to understand what a failure swing is so what a fai... Read More
Key Insights
- Failure swings occur when a swing high or low is not surpassed before a reversal.
- Low resistance liquidity is characterized by failure swings where liquidity rests above unswept highs and lows.
- High resistance liquidity involves sweeping liquidity above highs or lows before a reversal occurs.
- Traders should target low resistance liquidity and use high resistance liquidity as a stop loss point.
- Market structure shifts can indicate potential entry points after identifying liquidity patterns.
- Understanding liquidity patterns helps in framing a draw on liquidity or adding confluence to trading setups.
- Daily charts can reveal failure swings and liquidity patterns that guide trading biases.
- Order blocks are validated when a series of down-close candles are surpassed, forming a new support level.
Install to Summarize YouTube Videos and Get Transcripts
Explore YouTube Video Summarizer or Get YouTube Transcript Extractor
Questions & Answers
Q: How to identify low resistance liquidity?
Low resistance liquidity is identified through failure swings, where a swing high or low is not surpassed before a reversal. This results in liquidity resting above these unswept highs or lows, indicating potential targets for traders looking for market reversals or entries.
Q: What is high resistance liquidity?
High resistance liquidity occurs when liquidity resting above highs or lows is swept before a reversal. This pattern is used by traders to set stop losses or identify potential market reversals, as it indicates a stronger resistance level that has been tested.
Q: How can traders use liquidity patterns in trading?
Traders can use liquidity patterns to identify potential entry and exit points. By targeting low resistance liquidity and using high resistance liquidity as stop loss points, traders can better manage risk and enhance their trading strategies based on market structure shifts and liquidity sweeps.
Q: When should high resistance liquidity be used as a stop loss?
High resistance liquidity should be used as a stop loss when it indicates a tested level of liquidity that has been swept before a reversal. This provides a stronger indication of market resistance, allowing traders to set more reliable stop loss points and manage risk effectively.
Q: What role do failure swings play in liquidity analysis?
Failure swings are crucial in liquidity analysis as they indicate unswept highs or lows, forming low resistance liquidity. These patterns help traders identify potential targets for market entries or reversals, providing insights into market structure and liquidity dynamics.
Q: How does market structure shift indicate entry points?
Market structure shifts indicate entry points by showing changes in the state of delivery, often after liquidity sweeps. When a market structure shift occurs, it signals a potential reversal or continuation, allowing traders to identify entry points based on liquidity patterns and resistance levels.
Q: Why is it important to understand liquidity patterns in trading?
Understanding liquidity patterns is important in trading as it helps traders identify potential entry and exit points, manage risk, and enhance their strategies. By analyzing high and low resistance liquidity, traders can better understand market dynamics and make informed decisions.
Q: How do order blocks relate to liquidity patterns?
Order blocks relate to liquidity patterns as they represent validated support or resistance levels formed after a series of down-close candles are surpassed. These blocks indicate potential entry points and are used alongside liquidity patterns to enhance trading strategies and identify market reversals.
Summary & Key Takeaways
-
Failure swings are essential in identifying liquidity patterns. Low resistance liquidity involves failure swings where highs or lows remain unswept, while high resistance liquidity involves sweeping these levels before a reversal. Traders can use these insights to set stop losses and identify potential entry points.
-
In trading, understanding the difference between high and low resistance liquidity can aid in decision-making. High resistance liquidity occurs when liquidity above highs or lows is swept before a reversal, whereas low resistance liquidity involves unswept levels. These concepts help traders frame liquidity draws and set confluences.
-
Liquidity patterns such as failure swings are crucial for traders. Low resistance liquidity involves unswept highs or lows before a reversal, while high resistance liquidity involves sweeping them. Traders can leverage these patterns to set stop losses and target low resistance liquidity for potential entries.
Read in Other Languages (beta)
Share This Summary 📚
Summarize YouTube Videos and Get Video Transcripts with 1-Click
Try YouTube Summary with ChatGPT & Claude or YouTube Transcript Generator
Explore More Summaries from TTrades 📚


Summarize YouTube Videos and Get Video Transcripts with 1-Click
Try YouTube Summary with ChatGPT & Claude or YouTube Transcript Generator