How to Trade Candle 4 with the TTrades Fractal Model
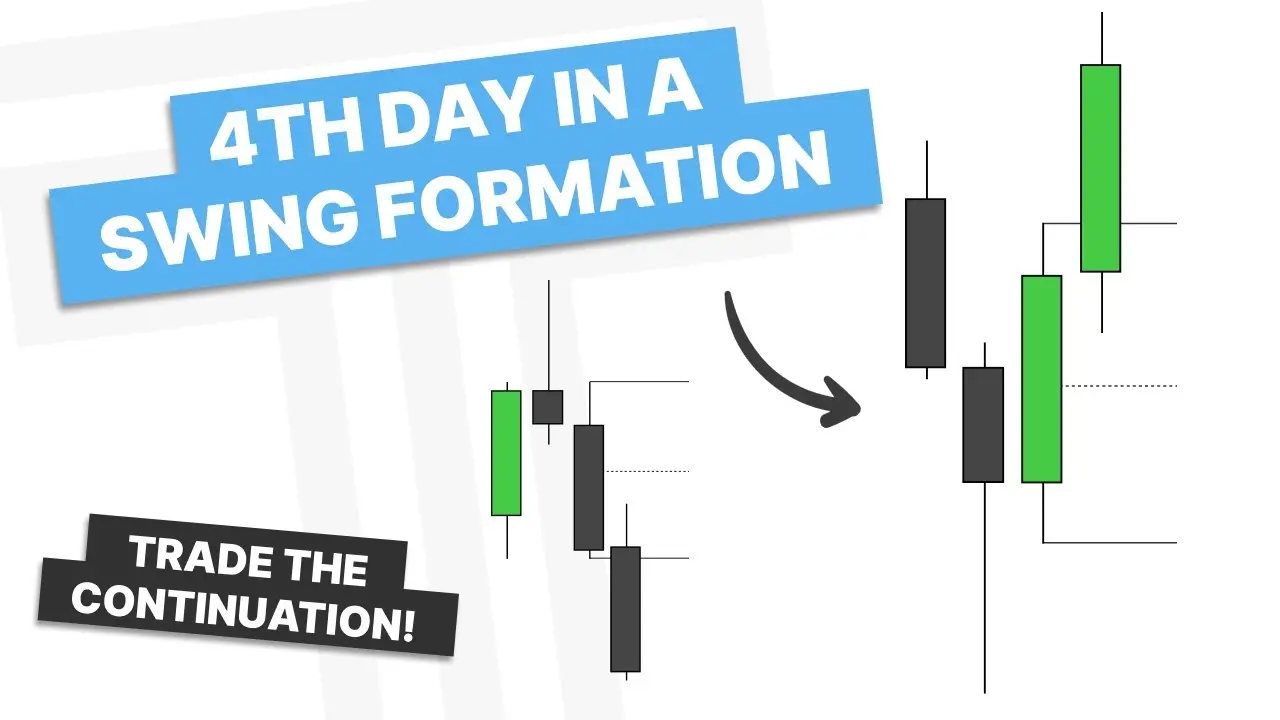
TL;DR
Trade candle 4 by first using the daily chart to identify a swing low or swing high and establish a directional bias. Then use a middle time frame for structure and a lower time frame for entry, seeking bullish continuation from candle 3’s upper half or bearish continuation from its lower half. Read on for the model’s confirmation, invalidation, entry, stop, and target rules.
Transcript
how's it going everyone in today's video we are going to talk about how to trade the fourth day in a swingo specifically using the daily time frame and that is where you get your daily swingo model or day four of that so if you have been following my content for a while you know the foundation of my model is built off the fact that the market canno... Read More
Key Insights
- Swing lows indicate potential bullish continuations on the next trading day.
- Swing highs suggest a bearish trend continuation.
- Aligning daily, middle, and lower time frames is crucial for optimal trading entries.
- Price expansions typically do not have deep retracements, indicating strength or weakness.
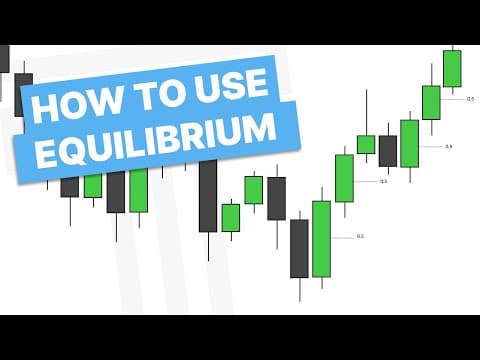
- The equilibrium of the third candle's range is critical to anticipate price movements.
- A daily bullish bias involves looking for the wick to form and trading continuations.
- Lower time frame PD arrays are used to form the low of the day.
- A closure through down close candles confirms a change in the state of delivery.
Install to Summarize YouTube Videos and Get Transcripts
Explore YouTube Video Summarizer or Get YouTube Transcript Extractor
Questions & Answers
Q: How do you trade candle 4 with the TTrades Fractal Model?
Use the daily time frame to identify a swing point and establish the expected direction for candle 4. Use a middle time frame for structure and a lower time frame for entry, aligning all three before taking the continuation trade.
Q: How do you identify a swing low or swing high?
A swing low is a low with a higher low on each side, while a swing high is a high with a lower high on each side. The model treats these formations as necessary when price changes from bearish to bullish or from bullish to bearish.
Q: What does a swing point suggest for candle 4?
After a swing low forms, the model anticipates a bullish continuation on the following day. A strong bearish closure in candle 3 supports anticipating a bearish continuation.
Q: Why is candle 3’s equilibrium important?
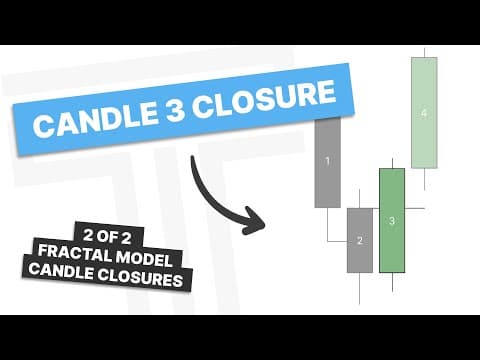
For bullish continuation, price should continue from the upper half of candle 3’s range. For bearish continuation, it should continue from the lower half, because an expansion should not require a deep retracement into the opposite half of that range.
Q: How are multiple time frames aligned for a candle 4 trade?
The daily chart supplies the candle 4 bias, the middle time frame supplies structure, and the lower time frame supplies the entry. In the example, the daily, 30-minute, and 3-minute charts aligned in one direction before the trade was taken.
Q: How is a bullish candle 4 setup refined on lower time frames?
Look for the daily wick and low to form above the equilibrium of candle 3, then locate lower-time-frame PD arrays in that area. In the example, fair value gaps and price action around the New York session helped refine the lower-time-frame setup.
Q: What confirms a lower-time-frame reversal in the example?
The setup first formed SMT with ES, suggesting that the tested low could hold. A closure through the down-close candle that formed the SMT then confirmed a change in the state of delivery on that time frame.
Q: Where are the invalidation, stop, and target placed?
For the bullish example, price was not expected to trade below the identified low, so a new low needed to form above that area. The entry used a stop at the low and targeted 2R; the example reached 2R, while higher objectives included the previous day’s high and a swing point to the left.
Summary & Key Takeaways
-
Trading the fourth day in a swing setup involves using the daily time frame to identify swing highs and lows. A swing low suggests a potential bullish continuation, while a swing high indicates a bearish trend. Aligning daily, middle, and lower time frames is key for optimal entry points, considering price expansions and retracements.
-
The video emphasizes the importance of the equilibrium of the third candle's range to anticipate price movements. Price expansions typically lack deep retracements, indicating strength or weakness. A daily bullish bias involves looking for the wick to form and trading continuations, using lower time frame PD arrays to form the low of the day.
-
A closure through down close candles confirms a change in the state of delivery. The strategy involves aligning all time frames and using the daily chart to frame direction, with lower time frames falling into line. Various entry methods are explored, including using lower time frames or skipping them.
Read in Other Languages (beta)
Share This Summary 📚
Summarize YouTube Videos and Get Video Transcripts with 1-Click
Try YouTube Summary with ChatGPT & Claude or YouTube Transcript Generator
Explore More Summaries from TTrades 📚

Summarize YouTube Videos and Get Video Transcripts with 1-Click
Try YouTube Summary with ChatGPT & Claude or YouTube Transcript Generator