How to Build an End-to-End SQL Analysis Project
TL;DR
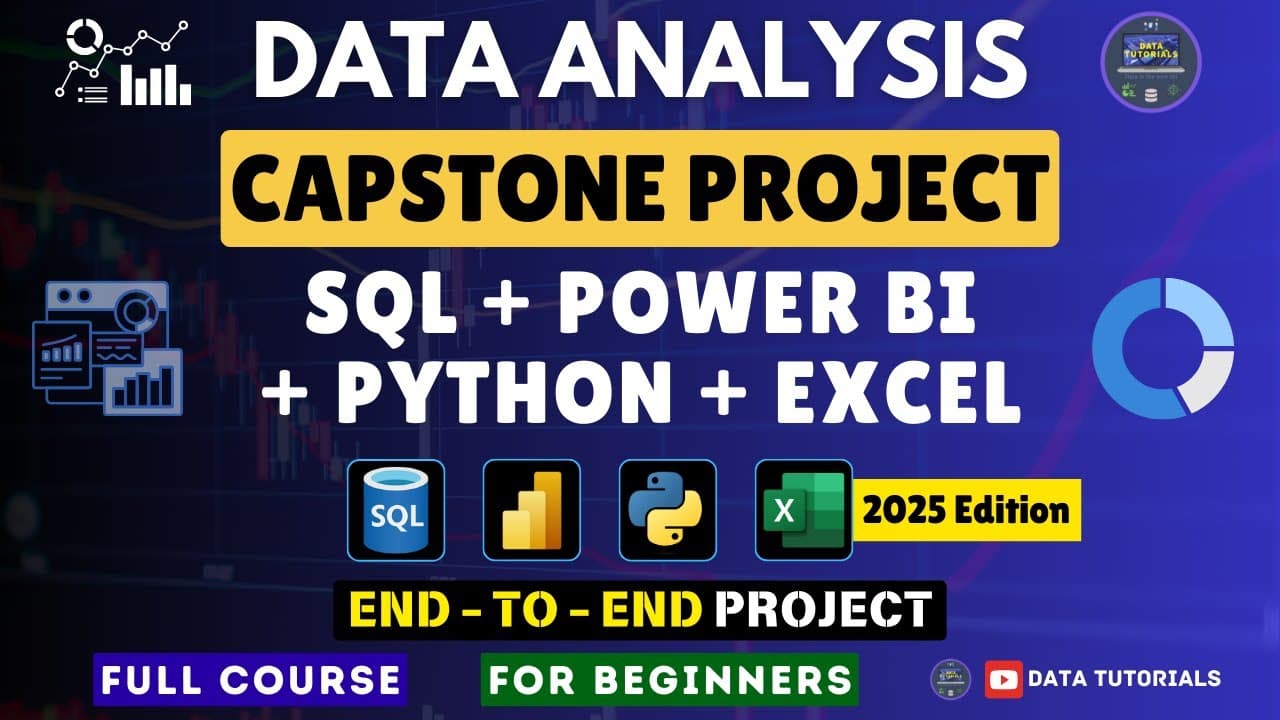
Start by translating the client's business requirements into four SQL KPIs: total sales, average sales, number of items sold, and average rating. Then investigate performance by fat content, item type, outlet establishment year, outlet size, outlet location, and outlet type to identify which products and stores contribute to gains or losses.
Transcript
Hey guys, welcome back to my channel. So in today's video we are going to see SQL project and this will be an data analysis SQL project. So this will be an start to end projects and the complete uh development and design we are going to see in this entire video how to write the SQL queries. uh and we will be using basics queries as well as advanced... Read More
Key Insights
- The project is structured around a client problem statement, a data walkthrough, and SQL query development. This sequence connects each query to a defined business requirement instead of treating SQL as an isolated technical exercise without a practical decision-making purpose.
- Total sales is the overall revenue generated by sold items during the period represented in the dataset. It serves as one of four high-level KPIs used to summarize how the Blinkit business is performing.
- Average sales measures the average revenue generated per order or sale. Used alongside total sales, item counts, and ratings, it provides management with a more complete view than overall revenue alone.
- The number of items sold is a core KPI that measures total item volume in the available data. Comparing this measure with sales can help distinguish product activity from the amount of revenue generated.
- Average rating summarizes the customer ratings recorded for the store. It adds a customer-response measure to the financial and volume KPIs, allowing performance to be considered beyond sales revenue alone.
- Granular analysis is required to identify the root causes behind high-level business performance. Breaking results down by products, outlets, and locations can show which areas are gaining money and which are not performing well.
- Outlet characteristics include establishment year, size, geographic location, and type. Analyzing sales and related metrics across these dimensions helps compare older and newer outlets, different store sizes, service areas, supermarkets, and grocery stores.
- The SQL project can be completed in Microsoft SQL Server, MySQL, PostgreSQL, Oracle, or another database because the queries used are described as compatible across these systems. The demonstration itself uses Microsoft SQL Server.
Install to Summarize YouTube Videos and Get Transcripts
Explore YouTube Video Summarizer or Get YouTube Transcript Extractor
Questions & Answers
Q: How do you start an end-to-end SQL data analysis project?
Start with the client's problem statement and identify the required business outputs before writing queries. In this project, the next step is to review the available Blinkit CSV data and understand its fields. SQL queries are then designed around four summary KPIs and several detailed breakdowns, ensuring that every output answers a stated business requirement.
Q: What KPIs should be calculated for the Blinkit sales analysis?
The analysis requires four KPIs: total sales, average sales, the total number of items sold, and average rating. Total sales represents overall revenue, while average sales describes revenue per order or sale. The item count measures sales volume, and average rating summarizes the customer ratings recorded for the store.
Q: Why should total sales be analyzed by fat content and item type?
Analyzing total sales by fat content and item type provides a more detailed view of product performance than a single overall revenue figure. The same dimensions can also be used to compare average sales, item counts, and average ratings. These breakdowns help identify which product categories contribute more strongly or weakly to business results.
Q: How can SQL analysis identify underperforming outlets?
SQL analysis can group sales and other metrics by outlet establishment year, size, location, and type. These comparisons reveal how different stores perform and help narrow a broad business problem to specific outlets or areas. The purpose of this deeper analysis is to identify where the business is losing money or gaining money and which outlets are not performing well.
Q: What does outlet establishment analysis measure?
Outlet establishment analysis compares performance according to when each outlet was opened. The business may establish additional outlets over time when an existing location cannot meet demand or when delivery distances become too large. Grouping sales and related metrics by establishment year makes it possible to compare outlets created at different points in time.
Q: Why are outlet size and location important in sales analysis?
Outlet size matters because stores can differ in scale, while outlet location reflects their geographic distribution and service areas. The project calculates the percentage of sales by outlet size and examines performance by location. These breakdowns help show whether revenue patterns vary across store sizes and the areas in which the outlets operate.
Q: Which databases can be used for this SQL analysis project?
The project can be completed using Microsoft SQL Server, MySQL, PostgreSQL, Oracle, or another database. The demonstration uses Microsoft SQL Server, but the queries included in the project are described as consistent across these database systems because database-specific queries that would create compatibility differences are not used in the presented analysis.
Q: How can this SQL project be used in a data analyst portfolio?
The queries and their outputs can be organized into a complete portfolio document based on the client's business requirements. That document can be uploaded to Git or another portfolio website and referenced in a resume. The project demonstrates the ability to move from a problem statement through data review, KPI creation, detailed analysis, and documented business findings.
Summary & Key Takeaways
-
The project begins with a client problem statement and a walkthrough of Blinkit store data before moving into SQL development. It is designed as a start-to-finish portfolio exercise that uses both basic and advanced queries to answer business requirements and produce outputs that can be documented for a resume or portfolio website.
-
Four high-level KPIs summarize business performance: total sales, average sales per order, the total number of items sold, and average customer rating. Management can use these metrics to understand overall results, while more granular analysis is needed to determine why particular products, stores, or geographic areas perform differently.
-
The detailed analysis groups performance by fat content, item type, outlet establishment year, outlet size, outlet location, and outlet type. These dimensions help reveal where sales are generated and which outlets may be underperforming. The demonstrated project uses Microsoft SQL Server, although the presented queries are intended to work across several databases.
Read in Other Languages (beta)
Share This Summary 📚
Summarize YouTube Videos and Get Video Transcripts with 1-Click
Try YouTube Summary with ChatGPT & Claude or YouTube Transcript Generator
Explore More Summaries from Data Tutorials 📚

Summarize YouTube Videos and Get Video Transcripts with 1-Click
Try YouTube Summary with ChatGPT & Claude or YouTube Transcript Generator