How to Build a Power BI & SQL Data Analyst Portfolio Project
TL;DR
Build a Power BI and SQL data analyst portfolio project by importing raw pizza-sales data into MS SQL Server, querying client requirements, documenting the results, and recreating them as two interactive Power BI dashboards. The project covers KPIs, sales trends, slicers, action filters, best and worst sellers, and validation between SQL and Power BI. Read on for the complete workflow and dashboard components.
Transcript
hey guys welcome back to my channel so in today's video we are going to see the complete data analyst portfolio project and in this project we are going to make use of SQL tool and power bi tool all right so these are the most important data analysis tool which are used right now in market and there is a very high demand for these particular tools ... Read More
Key Insights
- SQL and Power BI are the two most in-demand data analysis tools in the market right now, and this project uses both together step by step from basic to advanced level for beginners and intermediate learners.
- Two-way validation is achieved by comparing the values shown in the Power BI dashboard against the results from the SQL queries, which reassures the client that the dashboard numbers are pinpoint accurate.
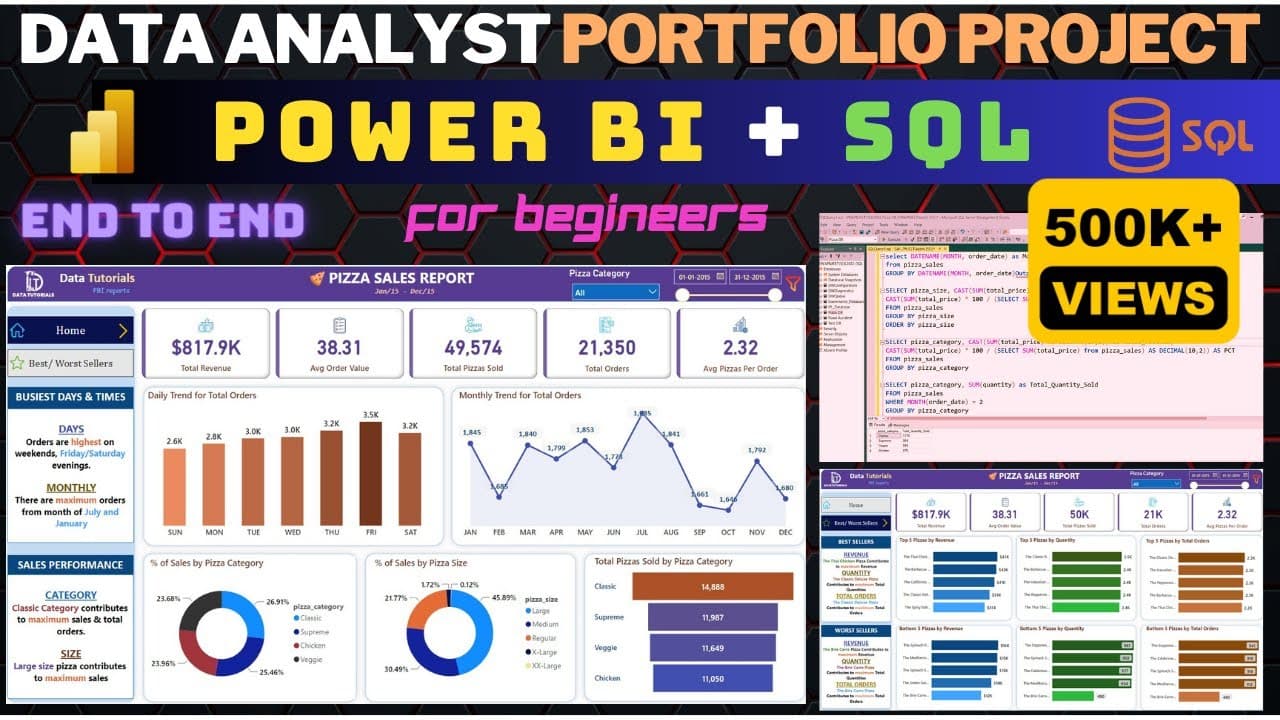
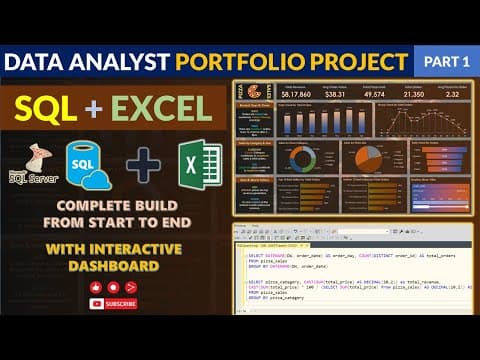
- The dashboard KPI card at the top is built using the new card visual released in June 2023, and it displays total revenue, average order value, pizzas sold, total orders, and average pizzas per order.
- The first dashboard includes a column chart for daily order trends, a line chart for monthly order trends, donut charts for percentage of sales by pizza category and size, and a funnel chart for total pizzas sold by category.
- Action filters (interactive filters) let clicking any chart element, such as a day like Sunday or a pizza category like Classic, filter the entire dashboard, in addition to the category and date-range slicer filters at the top.
- The second dashboard identifies best and worst sellers, showing top five and bottom five pizzas by revenue, by quantity, and by total orders so a restaurant owner can decide on discounts or discontinuing underperforming pizzas.
- The SQL queries used rely on ANSI standard functions, so the same queries work across MySQL, PostgreSQL, and Oracle, not only MS SQL Server, making the learning transferable.
- Saving queries alongside their result screenshots creates a supporting document that helps new resources understand the project and lets the team confirm Power BI output matches the SQL query results.
Install to Summarize YouTube Videos and Get Transcripts
Explore YouTube Video Summarizer or Get YouTube Transcript Extractor
Questions & Answers
Q: How do you build a Power BI and SQL data analyst portfolio project?
Start by importing the raw pizza-sales data into MS SQL Server, creating a database, and writing SQL queries based on the client’s problem statement. Save the queries and screenshots of their results, then connect Power BI to SQL Server and build the reports. Finally, compare the Power BI values with the SQL results to validate the dashboards.
Q: What tools and skills does this data analyst portfolio project use?
The project uses MS SQL Server for importing data, creating the database, and running queries, while Power BI is used to build interactive dashboards. It also covers advanced DAX functions, conditional filtering, conditional formatting, action filters, and data cleaning. The walkthrough progresses step by step from basic to advanced material.
Q: What is two-way validation between Power BI and SQL?
Two-way validation compares the values displayed in Power BI with the results returned by the SQL queries. Matching results provide supporting evidence that the dashboard numbers are correct. Saved queries and result screenshots form the document used for this comparison.
Q: What KPIs and charts are included in the first Power BI dashboard?
The KPI card displays total revenue, average order value, total pizzas sold, total orders, and average pizzas per order. The dashboard also includes a column chart for daily order trends, a line chart for monthly order trends, donut charts for sales percentage by pizza category and size, and a funnel chart for pizzas sold by category.
Q: How do slicers and action filters work in the Power BI dashboard?
The dashboard has slicers for pizza category and a start-to-end date range. Selecting categories such as chicken, classic, supreme, or veggie updates the displayed values. Clicking chart elements such as Sunday, Friday, Classic pizza, or a large pizza size also filters every chart on the dashboard.
Q: What does the best and worst seller dashboard show?
The second dashboard shows the top five and bottom five pizzas by revenue, quantity, and total orders. It helps identify the best-performing and underperforming pizzas. A restaurant owner can use these findings when considering discounts, other marketing actions, or stopping a poorly selling pizza category.
Q: Can the project be completed without MS SQL Server?
Yes. Because the raw data is available as a CSV file, it can be connected directly to Power BI through a flat-file or CSV connection. The same reports can then be built by following the Power BI steps without installing MS SQL Server.
Q: Can the SQL queries run on databases other than MS SQL Server?
The walkthrough states that the same queries can be used with MySQL, PostgreSQL, and Oracle as well as MS SQL Server. This is because the project uses standard functions. Some queries are easy and others are complex, providing a combination of difficulty levels.
Summary & Key Takeaways
-
The project is a complete end-to-end data analyst portfolio build using SQL and Power BI, the two most in-demand market tools, taught step by step from basic to advanced. It covers advanced DAX functions, conditional filtering, conditional formatting, and action filters for both beginners and experienced analysts.
-
The workflow starts in MS SQL Server: importing raw pizza-sales data, creating a database, and writing SQL queries against a client problem statement to produce KPIs, daily and monthly trends, and percentage of sales by category and size. Results are captured and documented with screenshots.
-
The Power BI side rebuilds these results as two interactive dashboards. The first shows KPIs, order trends, and sales breakdowns with slicers and action filters; the second highlights best and worst sellers by revenue, quantity, and orders to guide business decisions, validated against the SQL output.
Read in Other Languages (beta)
Share This Summary 📚
Summarize YouTube Videos and Get Video Transcripts with 1-Click
Try YouTube Summary with ChatGPT & Claude or YouTube Transcript Generator
Explore More Summaries from Data Tutorials 📚

Summarize YouTube Videos and Get Video Transcripts with 1-Click
Try YouTube Summary with ChatGPT & Claude or YouTube Transcript Generator