How to Do Top-Down Analysis with SMC and Price Action
TL;DR
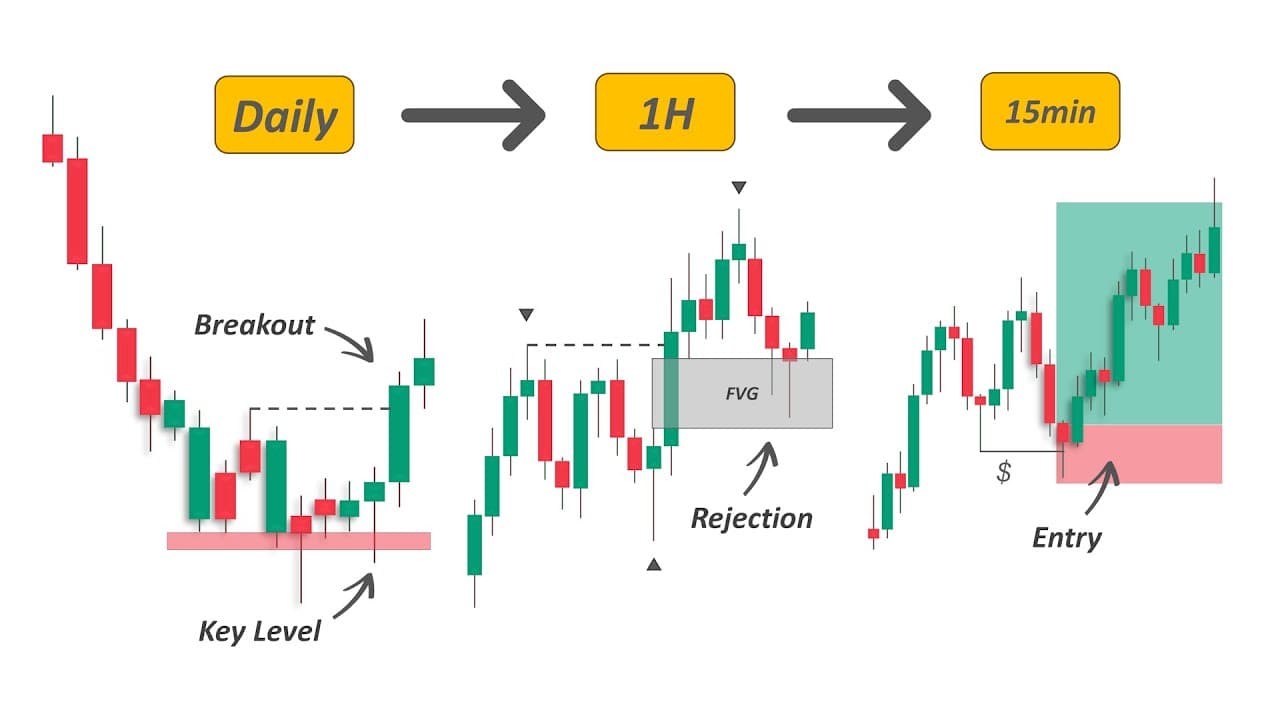
Top-down analysis starts with weekly and daily charts for the broader market picture, then moves to the 4-hour, 1-hour, and optionally 15-minute and 5-minute charts for detailed analysis and entries. The weekly chart is limited to key market structure levels, while price action and smart money concepts help identify direction, high-quality zones, and cleaner trades. Read on for the complete time-frame workflow.
Transcript
Hey guys, traders normally combine multiple time frames to get a more accurate analysis and a better entry. However, if you apply all the trading concepts from monthly time frames to lower ones, your chart will likely look like this, which is confusing and useless. So, is there any way to combine multiple time frames and still have a simple and cle... Read More
Key Insights
- Top-down analysis is starting chart analysis with higher time frames such as weekly and daily, then moving down to smaller details on the 4-hour, 1-hour, and 15-minute charts to get a more accurate read of the market before entering.
- Applying every concept you know from the monthly chart down to the lower time frames produces a chart that is confusing and useless. Simplicity helps traders avoid confusion, stay consistent, and make better decisions, so each time frame gets only a limited job.
- The weekly chart is used for one purpose only: identifying and marking key market structure levels. No other concepts are applied there, because the main trading time frame is the 1-hour chart and lower, and those levels only need to be visible when price taps them.
- On the daily chart, the weekly levels are first adjusted from the daily candlesticks, then daily key levels are drawn in a different color. The color separation lets you distinguish weekly from daily levels on lower time frames, since higher time frame levels are more important.
- The 4-hour chart is where smart money concepts begin: market direction, imbalance, supply and demand zones, and liquidity levels. The goal across the whole process is to identify the true market direction and key levels, spot high-quality zones, and enter a clean trade.
- A trend forms when price makes one, two, and three moves followed by a breakout, and it continues while price stays above the latest protected swing low. A close below that protected low is a change of character, signaling buyers failed to protect structure and sellers are taking control.
- Five criteria make a market structure level strong: it acted as both support and resistance, the move away from it was drastic, it produced multiple rejections, it is a turning point that previously reversed the trend, and it was recently respected or newly formed.
- Supply and demand zones are strengthened by three factors: inefficiency shown through fair value gaps between candles, a break of structure confirming buyers or sellers remain in control, and a large push distance away from the zone indicating a stronger rejection.
- "Top-down analysis is important because it helps you understand the market conditions better before you take any trade." (1:22)
- "In short, it keeps you on the right side of the market, reduces bad trades, and gives you more confidence in your decisions." (1:42)
- "The main chart analysis is done on the 4our and 1 hour charts." (4:17)
- "For extra confirmation, you can zoom into the 15-minute and 5-minut charts, but this part is optional." (4:22)
- "Market structure levels are important price zones on a chart where the market has previously shown a strong reaction." (5:15)
Install to Summarize YouTube Videos and Get Transcripts
Explore YouTube Video Summarizer or Get YouTube Transcript Extractor
Questions & Answers
Q: What is top-down analysis in trading?
Top-down analysis starts with higher time frames such as the weekly and daily charts, then moves to the 4-hour, 1-hour, and 15-minute charts for finer details. This approach provides a more accurate analysis before taking a trade.
Q: Why is top-down analysis important?
Higher time frames reveal the overall trend and strong market structure levels. Lower time frames can then provide cleaner entries, helping traders avoid trades against the bigger picture, reduce bad trades, and make decisions with more confidence.
Q: Which time frames does the Smart Risk top-down analysis strategy use?
The technique begins with the weekly and daily charts, while the main analysis happens on the 4-hour and 1-hour charts. The 15-minute and 5-minute charts can provide extra confirmation, but they are optional.
Q: How should the weekly chart be used?
The weekly chart is used only to identify and mark key market structure levels. Other concepts are unnecessary there because the main trading time frame is the 1-hour chart and lower, where those weekly levels remain visible when price reaches them.
Q: What is a market structure level?
A market structure level is an important price zone where the market previously showed a strong reaction. These levels matter because price may react strongly when it returns to them.
Q: What makes a market structure level strong?
The transcript identifies several criteria: the level acted as both support and resistance, price moved away drastically, and the area produced multiple rejections. The existing page fields also identify a previous trend reversal and recent respect as the remaining criteria among the five.
Q: How can higher time frames prevent a bad short trade?
A downtrend on the 15-minute chart may make a pullback look like a good short opportunity. If the 4-hour chart shows that price has reached a key market structure level, however, a reaction becomes more likely and the short trade deserves reconsideration.
Q: How can a lower time frame confirm a trade at a supply area?
After price pulls back to a supply area, a trader can seek confirmation by waiting for a trend-line break or a change of character below the previous market structure level. The trader can then look for new lower-time-frame supply zones to enter with greater accuracy.
Summary & Key Takeaways
-
Top-down analysis means starting chart analysis on higher time frames such as weekly and daily, then moving down to smaller details on the 4-hour, 1-hour, and 15-minute charts. It matters because it shows the overall trend and strong structure levels before a trade, keeps you on the right side of the market, reduces bad trades, and builds confidence in decisions.
-
Applying every trading concept from the monthly chart down to lower time frames produces a cluttered, confusing, and useless chart. The Smart Risk technique keeps it simple: the weekly and daily charts are used only for marking key market structure levels, the 4-hour and 1-hour charts carry the main analysis, and the 15-minute and 5-minute charts are optional extra confirmation.
-
A market structure level is a price zone where the market previously showed a strong reaction, and five criteria make one strong: it acted as both support and resistance, the move away from it was drastic, it produced multiple rejections, it was a turning point that reversed the trend, and it was recently respected. Levels are drawn as zones, not precise single lines.
Read in Other Languages (beta)
Share This Summary 📚
Summarize YouTube Videos and Get Video Transcripts with 1-Click
Try YouTube Summary with ChatGPT & Claude or YouTube Transcript Generator
Explore More Summaries from Smart Risk 📚
Summarize YouTube Videos and Get Video Transcripts with 1-Click
Try YouTube Summary with ChatGPT & Claude or YouTube Transcript Generator