How to Trade Crypto Using Supply and Demand Zones
TL;DR
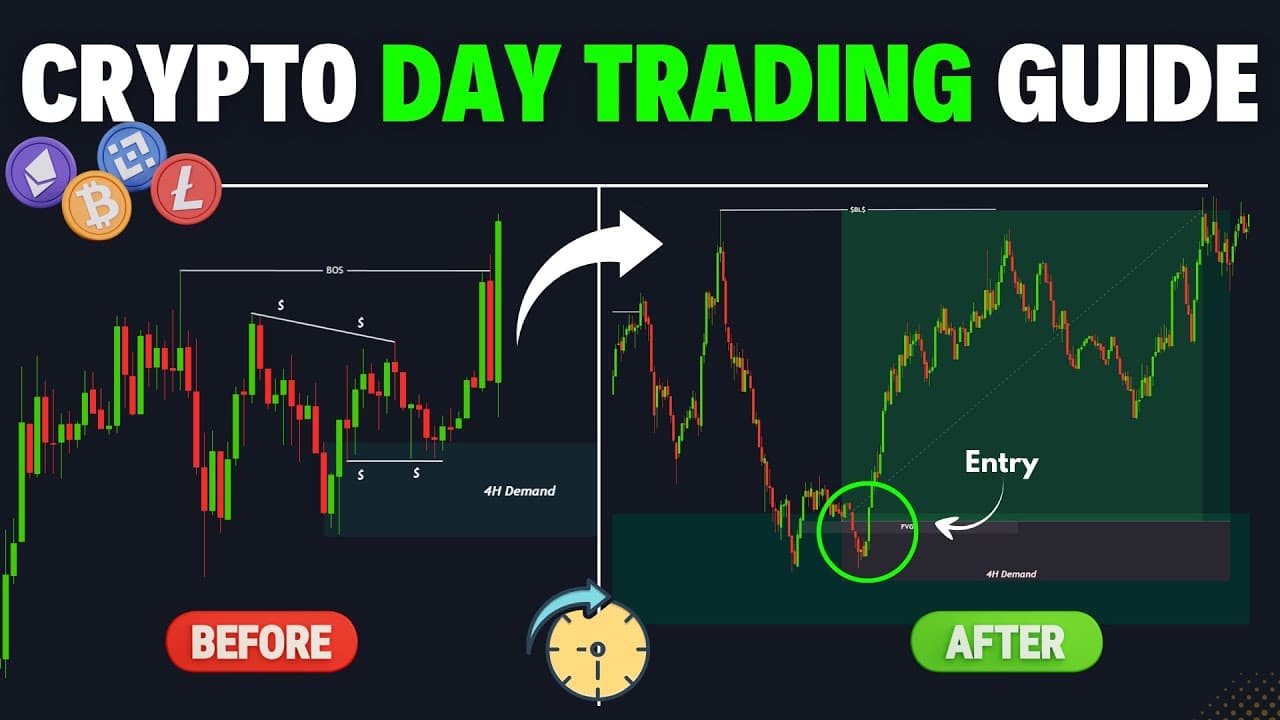
To trade crypto using supply and demand zones, mark the most recent unmitigated zone on the 4-hour or 1-hour chart, wait for price to revisit it, and seek reversal confirmation on the 5-minute or 15-minute chart. A valid zone begins at the impulse that caused a confirmed break of structure, not merely a wick above a high. Read on for the complete process of identifying, validating, and trading these zones.
Transcript
Hey traders and welcome to Smart Risk. Crypto markets are heating up. Bitcoin has smashed through its all-time high, crossing $124,000, but it's now losing dominance day by day, signaling the early stages of altcoin season. And that means massive opportunities ahead. Most crypto investors only focus on fundamentals and completely ignore technical a... Read More
Key Insights
- Supply and demand zones are the areas from which price makes a strong impulsive move that leads to a break of structure. In a bullish trend each break of a previous high forms a new unmitigated demand area tied to that impulse leg, while a break below a major low forms supply.
- The reason price respects these zones is that institutions scale into positions gradually rather than entering all at once. Not all of their original orders are filled during the first move, so a return to the zone gives them a second chance to execute the remainder.
- Drawing a zone correctly means focusing on the very beginning of the impulse that caused the break of structure. The opposing colored candles at that origin, such as the last two or three consecutive down close candles before the expansion, form the demand zone.
- A wick above a swing high that closes back inside the range is a liquidity sweep, not a break of structure. Because there is no actual structural break, no new demand or supply zone is created; price is simply grabbing liquidity resting above that high to fuel momentum.
- Mitigation is judged only after the break of structure. If price never reached the demand after the BOS, the zone is still unmitigated, because any mitigation that occurred before the break of structure does not count toward invalidating it.
- Supply and demand zones are a one-time use concept, like order blocks. They are only traded or analyzed on the first interaction, and once mitigated they stop being an area of interest, so focus shifts to the next zone as a sign of trend continuation.
- Failed zones are those price breaks through and closes beyond with the candle body in the opposite direction. They are valuable because they reveal which side is in control, where market structure shifts may happen, and how to prepare for the next big move.
- Entry price is presented as the factor that determines whether you survive in the market and make consistent profits, regardless of whether you buy to hold long term, trade spot, or use margin with leverage. The approach works best in the most liquid coins such as Bitcoin, Ethereum, and Solana.
Install to Summarize YouTube Videos and Get Transcripts
Explore YouTube Video Summarizer or Get YouTube Transcript Extractor
Questions & Answers
Q: How do you trade crypto using supply and demand zones?
Identify the most recent unmitigated demand or supply zone on the 4-hour or 1-hour chart, then wait for price to return to it. Move to the 5-minute or 15-minute chart and wait for a market structure shift or change of character. After confirmation, use a fair value gap, order block, or inverse fair value gap within the shift leg as the entry zone.
Q: What are supply and demand zones in crypto trading?
Supply and demand zones are areas where price begins a strong impulsive move that produces a break of structure. A break above a previous high forms a demand area tied to the bullish impulse leg, while a break below a major low forms a supply area. These zones mark the origins of significant price moves.
Q: Why does price reverse from supply and demand zones?
The method describes these zones as areas where smart money initially enters positions and may later defend them. It also says institutions scale into positions gradually, so some original orders may remain unfilled after the first move. Returning to the zone gives them another opportunity to execute those orders.
Q: How do you draw a demand zone correctly?
Start at the origin of the impulse that caused a confirmed bullish break of structure. Mark the opposing down-close candles immediately before the expansion, such as the last two or three consecutive down-close candles shown in the examples. The zone should represent where price launched upward, not an arbitrary part of the impulse.
Q: What is the difference between a liquidity sweep and a break of structure?
A bullish break of structure requires price to close above the previous major high. If price only penetrates the high with a wick and closes back inside the range, the move is a liquidity sweep. Because no structural break occurred, the candle before that sweep does not create a valid new demand zone.
Q: What are mitigated, unmitigated, and failed zones?
A mitigated zone has already been tapped and respected after the break of structure, while an unmitigated zone has not been revisited since its formation. Any tap occurring before the break of structure does not count as mitigation. A failed zone is one price breaks through and closes beyond with the candle body in the opposite direction.
Q: Which chart time frames should you use for crypto supply and demand zones?
Use the 4-hour or 1-hour chart to identify the higher-time-frame supply or demand zone because those zones are described as more likely to hold in crypto. After price returns to the zone, use the 5-minute or 15-minute chart to confirm the reversal and refine the entry. The higher time frame supplies the area of interest, while the lower time frame supplies the timing.
Q: What should confirm an entry after price reaches a demand zone?
First wait for a market structure shift or change of character on the 5-minute or 15-minute chart. Then find a bullish fair value gap, order block, or inverse fair value gap formed within the market-structure-shift leg. The plan places the buy limit order at one of those entry zones rather than entering solely because price touched demand.
Summary & Key Takeaways
-
Supply and demand zones are the areas from which price makes a strong impulsive move that leads to a break of structure. In a bullish scenario, every time price breaks a high to the upside it creates an unmitigated demand area tied to the impulse leg; in a bearish trend, breaking a major low to the downside forms an unmitigated supply area.
-
These zones matter because they are where smart money first enters positions, often at the origin of a trend. Institutions do not enter all at once but scale in gradually, so not all original orders get filled during the first move. When price returns to the demand zone, they treat it as a second chance to execute the rest.
-
Zones fall into three categories: mitigated (price already tapped and respected it at least once), unmitigated (price has not tapped it since formation), and failed (price breaks through and closes beyond with the candle body). Mitigation only counts after the break of structure; taps before the BOS do not count.
-
The crypto model starts by identifying the most recent unmitigated demand zone on the 4-hour or 1-hour chart, since those time frames are much more likely to hold in crypto. Once price returns, zoom into the 5-minute or 15-minute chart and look for a market structure shift or change of character as first confirmation.
-
After the market structure shift is confirmed, look for a bullish fair value gap, an order block, or an inverse fair value gap formed within the market structure shift leg. These act as magnets where price is likely to retrace before continuing upward, and you place a buy limit order at one of those entry zones.
Read in Other Languages (beta)
Share This Summary 📚
Summarize YouTube Videos and Get Video Transcripts with 1-Click
Try YouTube Summary with ChatGPT & Claude or YouTube Transcript Generator
Explore More Summaries from Smart Risk 📚

Summarize YouTube Videos and Get Video Transcripts with 1-Click
Try YouTube Summary with ChatGPT & Claude or YouTube Transcript Generator