How to Identify a Valid Pullback in Forex Trading
TL;DR
A pullback is valid only when a candle breaks below the lowest point of the previous candle in a bullish move, or above the highest point of the previous candle in a bearish move, sweeping that liquidity. Candle color is irrelevant. Pullbacks fall into three models: aggressive, corrective, and sweeping, and each demands a different entry decision.
Transcript
hello Traders and welcome to another episode of smart risk identifying a valid pullback is one of the most challenging and key steps in Market structure analysis that every Trader encounters acquiring the skill to recognize valid pullbacks allows you to identify authentic order blocks and inducement zones in the market helping you avoid potential t... Read More
Key Insights
- A pullback is a temporary reversal or pause in price action against the prevailing trend, occurring when buyers and sellers contend for dominance. It fills internal liquidity or clears static liquidity before price continues in its overall direction.
- Valid pullback identification is the first step in market structure mapping. Without it, a trader cannot recognize upcoming price movements such as continuation trends, valid breaks of structure, or reversal patterns.
- In a bullish scenario, a pullback is valid only when a candle breaks below the lowest point of the previous candle and sweeps its liquidity. If price fails to break that low, the sequence is a single impulse move, not a pullback.
- Candle color plays no role in identifying pullbacks. What matters is whether the low (bullish context) or high (bearish context) of the last candle before the temporary pause is broken and swept.
- A candlestick-based uptrend produces consecutive bullish candles, each exceeding the high of the previous one, with each candle's low equal to or higher than the previous lows, showing bearish momentum is restricted.
- Misreading an impulsive move as a valid pullback invalidates the order block derived from it, which raises the probability that price runs through the level and triggers the stop loss.
- Price movement consists of three main sub-movements: impulse, corrective, and continuation. A confirmed break of structure follows a valid corrective move, and the order block attributed to that break becomes the entry zone.
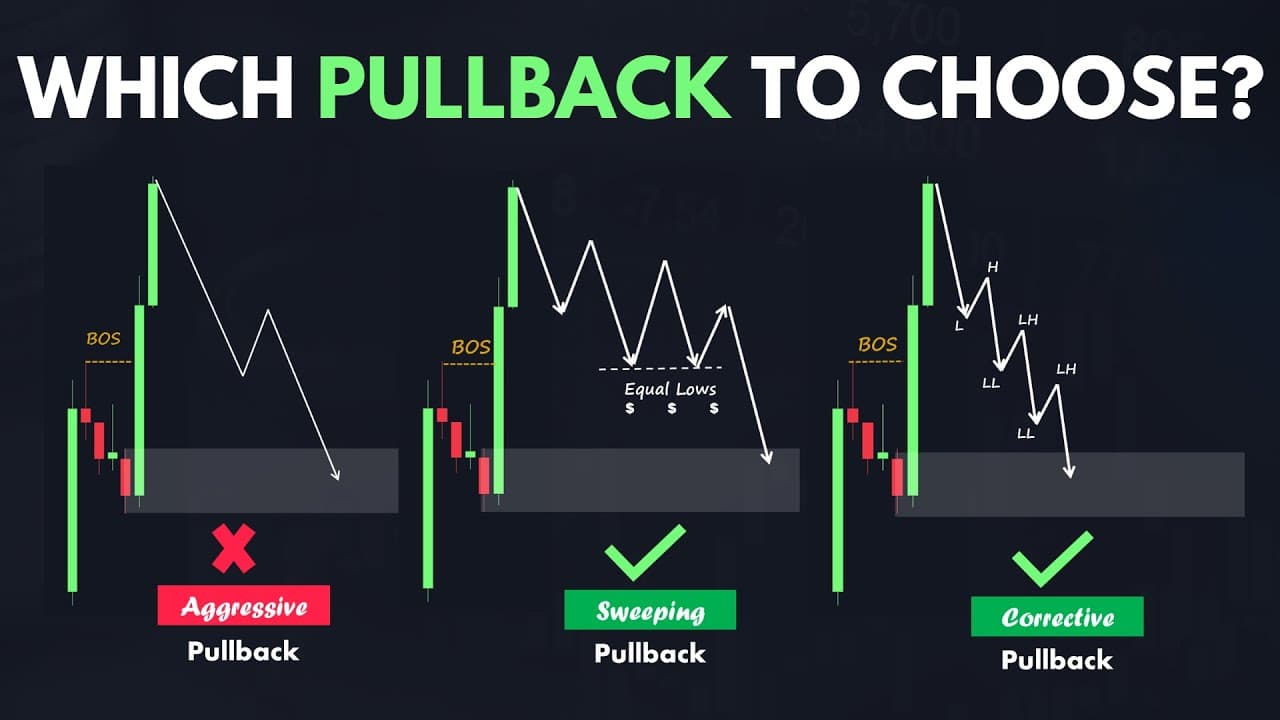
- Pullbacks are categorized into three models: aggressive, corrective, and sweeping. The model that forms as price approaches a supply or demand zone determines whether an entry should be taken at all.
Install to Summarize YouTube Videos and Get Transcripts
Explore YouTube Video Summarizer or Get YouTube Transcript Extractor
Questions & Answers
Q: What is a pullback in forex trading?
A pullback is a temporary reversal or pause in the price action against the prevailing trend. It occurs when buyers and sellers contend for dominance in the market, leading to a trending or impulsive movement that creates internal liquidity characterized by inefficiency or static liquidity waiting to be swept or filled. Price then experiences a reversal and a brief interruption against the dominant trend, filling the internal liquidity or clearing static liquidity, before continuing in its overall direction.
Q: How to identify a valid pullback on a candlestick chart?
In a bullish scenario, a valid pullback occurs when a candle breaks below the lowest point of the previous candle, effectively sweeping its liquidity. Specifically, price must break below the lowest point of the last bullish candle formed just before the temporary pause. In a bearish scenario, the mirror rule applies: a valid pullback occurs when a candle breaks above the highest point of the previous candle, sweeping liquidity in the process. The color of the candle does not play a role in identifying pullbacks.
Q: Why does an invalid pullback cause a stop loss to be hit?
Market structure conclusions are built on the pullback. If a move is mistakenly considered a valid pullback due to its impulsive nature when it is actually invalid, the break of structure it appears to confirm is not real, and the order block identified from that break loses its validity. Placing a buy limit at the highest point of that invalid order block leaves the trade sitting at a level with no genuine reason to reverse price, so there is a high probability of price triggering the stop loss.
Q: What are the three types of pullbacks in smart money concepts?
Pullbacks can be categorized into three distinct models: aggressive, corrective, and sweeping. The aggressive pullback is a rapid and sharp retracement against the prevailing trend, often formed by a couple of large and strong candles that quickly retrace a portion of the recent price movement. The corrective pullback is a more gradual retracement typically consisting of multiple smaller candles. The video covers the sweeping pullback as the third model, listed in the chapters at 12:48.
Q: When should you avoid entering a trade at a demand or supply zone?
Avoid entering when the retracement into the zone is an aggressive pullback. If price moves rapidly and drastically with strong candles into a supply or demand zone without subsiding its momentum, there is a high probability that price will not react to that zone. In this scenario no position should be opened even when confirmation patterns appear, such as a change of character or a flip pattern on the lower time frame. Traders need to closely monitor price behavior in such cases.
Q: What is a corrective pullback and how do you trade it?
The corrective pullback is a more gradual retracement that typically consists of multiple smaller candles. In this model price generates several internal structures until it reaches the point of interest, and its momentum and volatility subside as it approaches that point of interest. Unlike the aggressive pullback, this model does justify entering the market when price reaches the identified demand or supply zone. For execution, traders can use smart money concepts entry models such as the aggressive entry model or the conservative entry model.
Q: What defines a candlestick-based uptrend and downtrend?
A candlestick-based uptrend is a pattern in which price action produces consecutive bullish candles, each exceeding the highest point of the previous one, signifying strong upward momentum. For a single bullish impulsive movement, each candle's lowest point must remain equal to or higher than the lowest point of the previous candles, indicating bearish momentum is restricted. A candlestick-based downtrend mirrors this: consecutive bearish candles each exceeding the previous low, with each candle's highest point remaining equal to or lower than the previous highs.
Q: How many times should you back test a trading strategy before going live?
The video recommends back testing at least 100 times before applying any strategy to a real account. This is presented as a crucial step in a trading journey, placed deliberately between the explanation of the aggressive pullback model and the corrective pullback model. The reasoning is that pullback validity rules and the three pullback models change the entry decision, so a trader needs a large enough sample of tested occurrences to trust the plan before risking real capital.
Summary & Key Takeaways
-
Identifying a valid pullback is the first step in market structure mapping and one of the most challenging skills in market structure analysis. Recognizing valid pullbacks lets traders identify authentic order blocks and inducement zones, avoid traps, and confirm breaks of structure, continuation trends, and reversal patterns before committing to a trade.
-
The candlestick rule is precise. In a bullish context, price must break below the lowest point of the last bullish candle formed before the temporary pause. Three bearish candles that never break the preceding low do not qualify, and the whole sequence is read as a single bullish impulse move instead.
-
Three pullback models exist: aggressive, corrective, and sweeping. An aggressive pullback retraces sharply with a couple of large strong candles, and entry is avoided even with a change of character or flip pattern, because momentum that never subsides is unlikely to react at the zone.
-
The corrective pullback is a gradual retracement built from multiple smaller candles that form several internal structures on the way to the point of interest, with momentum and volatility subsiding on approach. This model does justify entry, using smart money concepts entry models such as aggressive or conservative entry.
-
The video recommends back testing any strategy at least 100 times before applying it to a real account. The principles apply across various time frames and any price action based chart, demonstrated on the EUR/USD 1-hour time frame during a strong downtrend.
Read in Other Languages (beta)
Share This Summary 📚
Summarize YouTube Videos and Get Video Transcripts with 1-Click
Try YouTube Summary with ChatGPT & Claude or YouTube Transcript Generator
Explore More Summaries from Smart Risk 📚


Summarize YouTube Videos and Get Video Transcripts with 1-Click
Try YouTube Summary with ChatGPT & Claude or YouTube Transcript Generator