How to Use Top-Down Analysis for Trading Success
TL;DR
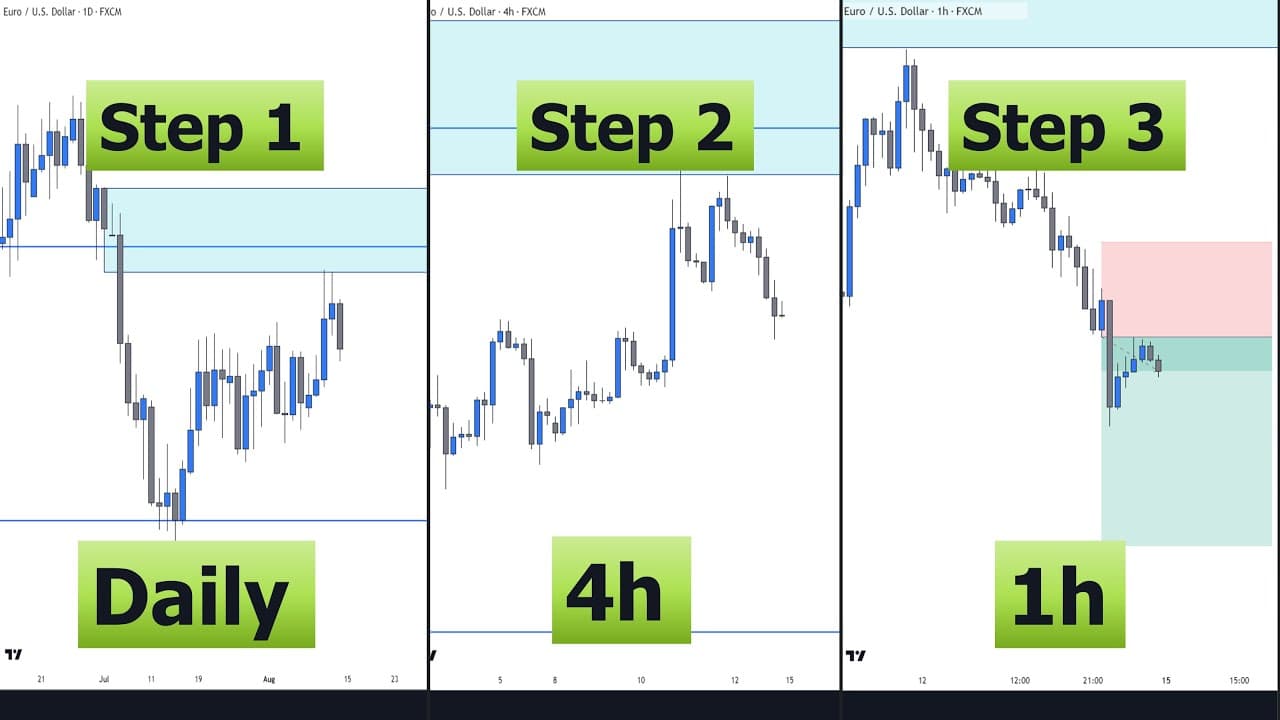
Top-down analysis involves using multiple time frames to gain a comprehensive view of market conditions, starting from higher time frames and moving to lower ones. This method helps overcome directional confusion, increase accuracy, and optimize trade entries by identifying key market levels and trends.
Transcript
Hey guys, welcome to another episode. In this video, we will show you the best technique to combine multiple time frames to get a well-informed and clear chart analysis. By combining price action and smart money concepts, we will demonstrate how to effectively make a top-down analysis to identify the market direction, supply and demand levels, liqu... Read More
Key Insights
- Top-down analysis combines multiple time frames to understand market conditions.
- Higher time frames provide a major view of market direction and key areas.
- Directional confusion is reduced by identifying trends on higher time frames.
- Accuracy is increased by checking higher time frame levels before trades.
- Optimal trade entries are identified by analyzing multiple time frames.
- Weekly and daily time frames identify key market structure levels.
- 4-hour and 1-hour time frames analyze market direction and trading opportunities.
- 15-minute and 5-minute time frames provide confirmations for trade entries.
Install to Summarize YouTube Videos and Get Transcripts
Explore YouTube Video Summarizer or Get YouTube Transcript Extractor
Questions & Answers
Q: How to perform a top-down analysis in trading?
Top-down analysis in trading involves examining multiple time frames to understand market conditions. Start with higher time frames like weekly and daily to identify key market structure levels. Then, use 4-hour and 1-hour charts to analyze market direction, supply and demand areas, and trading opportunities. Finally, use 15-minute and 5-minute charts for confirmation before entering trades.
Q: Why is top-down analysis important for traders?
Top-down analysis is crucial for traders as it provides a comprehensive view of market conditions by examining multiple time frames. This approach helps traders overcome directional confusion, increase accuracy, and optimize trade entries by identifying key market levels and trends. It enhances decision-making by offering a clearer picture of potential market movements.
Q: What are the benefits of using higher time frames in trading?
Using higher time frames in trading offers several benefits. It provides a broader view of market trends, helping traders overcome directional confusion. Higher time frames also identify key levels where significant market reactions may occur, allowing traders to set more accurate targets and stop losses. This approach enhances trade accuracy and confidence.
Q: How does top-down analysis increase trade accuracy?
Top-down analysis increases trade accuracy by examining higher time frame levels before placing trades. This approach helps traders identify key market levels where significant reactions may occur, allowing them to set precise targets and stop losses. By understanding the broader market context, traders can make more informed decisions and avoid unnecessary risks.
Q: What is the role of smart money concepts in top-down analysis?
Smart money concepts play a crucial role in top-down analysis by identifying market direction, supply and demand areas, order blocks, and liquidity zones. These concepts help traders understand market dynamics and potential trading opportunities on 4-hour and 1-hour time frames, providing a structured approach to analyze market conditions and optimize trade entries.
Q: How can traders optimize trade entries using top-down analysis?
Traders can optimize trade entries using top-down analysis by examining multiple time frames to identify optimal entry and exit points. By analyzing higher time frames, traders can determine the overall market direction and key levels, while lower time frames provide confirmations for precise entries. This approach reduces false signals and increases confidence in trade decisions.
Q: What are the key levels in market structure analysis?
Key levels in market structure analysis are significant price points where the market has previously reacted. These levels include turning points, multiple rejections, areas acting as both support and resistance, drastic moves away from the area, and recently respected or created levels. Identifying these levels helps traders anticipate potential market reactions and set accurate targets.
Q: Why is backtesting important for trading strategies?
Backtesting is important for trading strategies as it allows traders to evaluate the performance of their strategies using historical data. By testing strategies on different pairs, traders can build confidence, understand potential risks, and optimize their strategies by fine-tuning parameters and rules. This process helps improve trading performance and decision-making.
Summary & Key Takeaways
-
Top-down analysis involves using multiple time frames to gain a comprehensive understanding of market conditions, starting from higher time frames and moving to lower details. This approach helps traders identify market direction, supply and demand levels, and trading opportunities, ultimately improving trade accuracy and entry optimization.
-
By analyzing higher time frames, traders can overcome directional confusion and set more accurate targets and stop losses. This method helps identify key levels where the market might react, allowing traders to make informed decisions and avoid unnecessary risks.
-
The process involves marking key levels on weekly and daily charts, applying smart money concepts on 4-hour and 1-hour charts, and using 15-minute and 5-minute charts for confirmations. This structured approach allows traders to optimize their strategies and improve trading performance.
Read in Other Languages (beta)
Share This Summary 📚
Summarize YouTube Videos and Get Video Transcripts with 1-Click
Try YouTube Summary with ChatGPT & Claude or YouTube Transcript Generator
Explore More Summaries from Smart Risk 📚
Summarize YouTube Videos and Get Video Transcripts with 1-Click
Try YouTube Summary with ChatGPT & Claude or YouTube Transcript Generator