How to learn observability fundamentals in 5 hours?
TL;DR
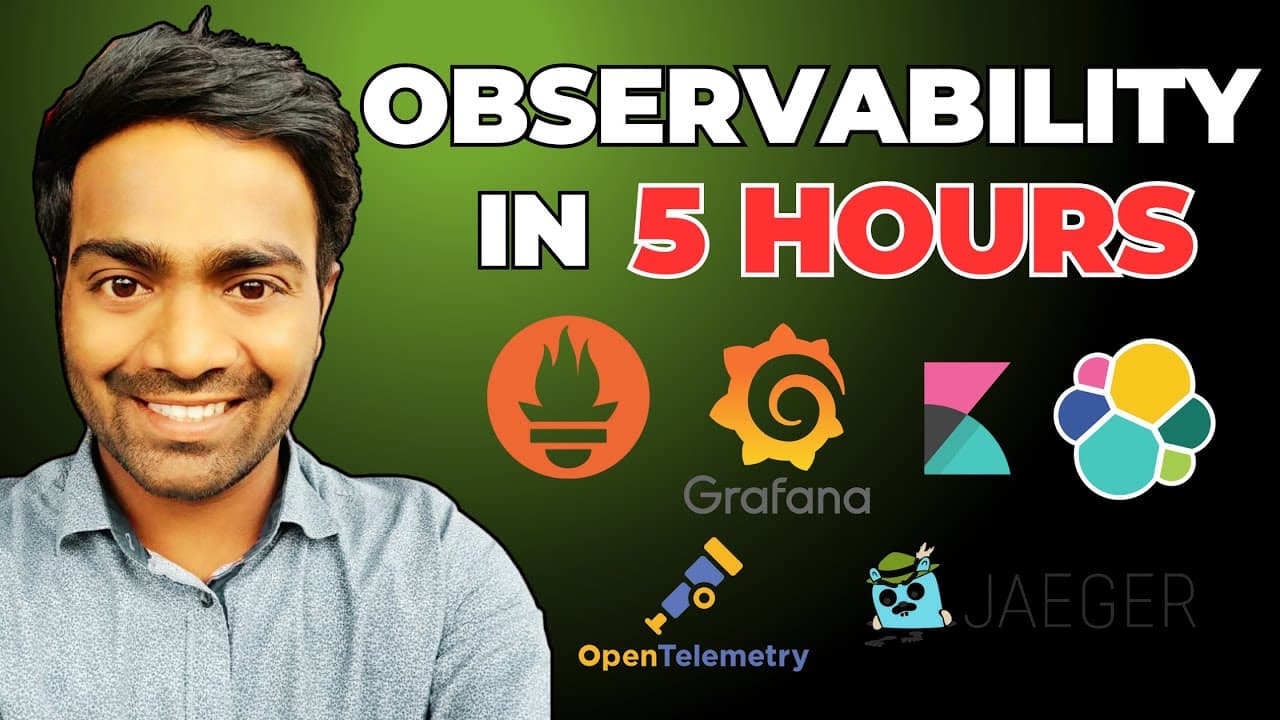
Observability centers on three pillars: metrics, logs, and traces, to reveal both what is happening and why. The video outlines a 7 day, theory plus practical, course on kubernetes observability using open telemetry, Prometheus, grafana, logging stacks, tracing concepts, and ebpf. It emphasizes day by day progression and notes from a GitHub repo.
Transcript
hello everyone my name is abishek and welcome back to my channel this is the very first episode of observability Zero to Hero series and in this video we will learn about the fundamentals of observability so this is a very important episode make sure you watch this video till the end now because this is the very first episode of the observability Z... Read More
Key Insights
- Observability is built on three pillars: metrics, logs, and traces.
- The series is designed to run over seven days with theory and practical content.
- Prometheus serves as the core tool for monitoring in day two onward.
- PromQL is introduced in day three to query Prometheus data.
- Instrumentation and custom metrics are covered using the Prometheus client library.
- Logging is addressed with EFk/ELK stacks for aggregation and visualization.
- Tracing concepts include distributed tracing and OpenTelemetry.
- The final episodes introduce ebpf to enhance observability capabilities.
Install to Summarize YouTube Videos and Get Transcripts
Explore YouTube Video Summarizer or Get YouTube Transcript Extractor
Questions & Answers
Q: A real search query question about the video (e.g. 'How to...', 'What is...', 'Why does...', 'When should...'). Question 1
What is observability and why is it important for Kubernetes and microservices? Observability is defined as obtaining information about the internal state of the system, covering the application, infrastructure, and networking. It helps you understand what is happening, why it is happening, and how to fix issues by using three pillars: metrics, logs, and traces. This approach enables you to diagnose performance problems, detect failures, and improve system reliability in complex environments.
Q: Question 2
What are the three pillars of observability and what does each one provide? Metrics reveal the state of the system over time, such as CPU, memory, and request counts. Logs provide detailed records for diagnosing why issues occur, including timestamps and messages. Traces show the end-to-end path of requests across components, helping to identify where delays or failures happen. Together, they offer a complete picture from what is happening to why and how to fix it.
Q: Question 3
How is the seven-day series organized and what topics are covered on day two and beyond? The series starts with fundamentals on day one, followed by day two which focuses on Prometheus setup and basic monitoring, then day three covers PromQL queries, and day four discusses instrumentation and custom metrics. Subsequent days cover advanced Prometheus concepts, logging with EFk, tracing with OpenTelemetry, and finally ebpf in day seven.
Q: Question 4
What tools are introduced for monitoring and observability in the video, and how are they used? Prometheus is used for collecting metrics, Grafana for dashboards, and the kube-prometheus-stack for integration. For logging, the EFk/ELK stack is introduced to aggregate and visualize logs. For tracing, OpenTelemetry is used to instrument and collect traces, with potential use of Jaeger for visualization.
Q: Question 5
How can a learner use the GitHub notes mentioned in the video to study observability effectively? The GitHub repository contains day-wise notes, architecture diagrams, scripts, and YAML manifests. Learners can access complete notes from day 1 to day 7, use them as revision material, and follow the exact code and configurations demonstrated in the videos to reinforce concepts and practice the practical steps.
Q: Question 6
What is OpenTelemetry and what role does it play in tracing within the series? OpenTelemetry provides a collection of APIs and SDKs to instrument traces, metrics, and logs across programming languages. In the series, it is used to instrument distributed tracing so you can observe how a request moves through the system, identify bottlenecks, and understand the timing across components.
Q: Question 7
How does the video describe the difference between monitoring and observability? Monitoring is presented as tracking the state of a system using predefined checks and metrics, while observability expands that view by explaining why the system is in its current state and how to resolve issues. Observability combines metrics, logs, and traces to provide a holistic understanding of system behavior.
Q: Question 8
What is the expected outcome for a beginner watching the series on observability? The series is designed so that even beginners with basic Kubernetes knowledge can learn observability. It emphasizes fundamentals, practical demonstrations, and notes that accompany each episode, enabling learners to build a complete observability stack step by step and apply concepts to real Kubernetes environments.
Summary & Key Takeaways
-
Observability is defined as gaining information about the internal state of a system, including application, infrastructure, and networking. It covers what is happening, why it is happening, and how to fix issues using metrics, logs, and traces. It also differentiates observability from traditional monitoring.
-
The video describes a seven episode series beginning with fundamentals, then moving into Prometheus for monitoring, PromQL for queries, instrumentation of custom metrics, logging with EFk/ELK stacks, tracing with open telemetry, and ebpf advantages.
-
Notes and diagrams are provided in a GitHub repository to accompany every day from day 1 to day 7, including scripts and YAML manifests for practical learning and revision.
Read in Other Languages (beta)
Share This Summary 📚
Summarize YouTube Videos and Get Video Transcripts with 1-Click
Try YouTube Summary with ChatGPT & Claude or YouTube Transcript Generator
Explore More Summaries from Abhishek.Veeramalla 📚
Summarize YouTube Videos and Get Video Transcripts with 1-Click
Try YouTube Summary with ChatGPT & Claude or YouTube Transcript Generator