How to Draw RSI Trend Lines to Spot Trend Reversals
TL;DR
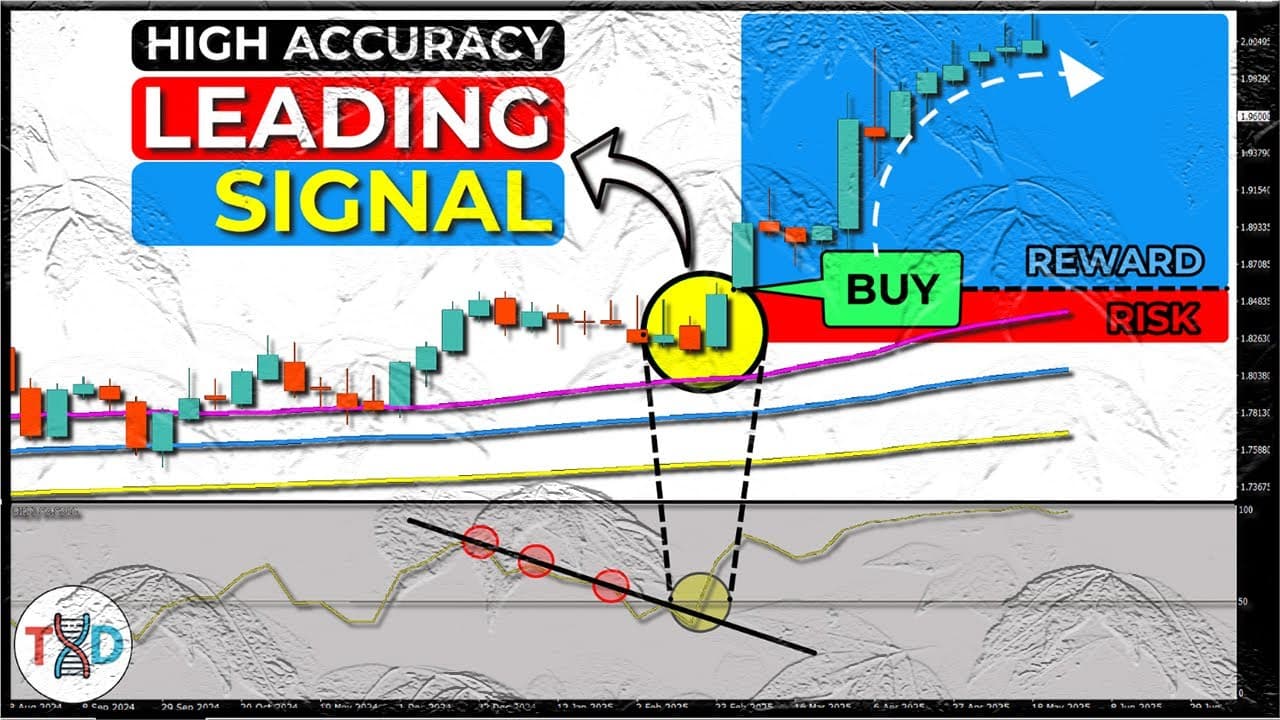
Trend lines can be drawn directly on the RSI, not just on price: connect swing lows during an uptrend and swing highs during a downtrend. When RSI breaks that line, it often signals the current trend is ending before price reacts. Confirm the break against support, resistance, and overall trend direction, and place stops beyond the most recent swing high or low.
Transcript
Stop scrolling. If you've ever placed a trade and lost money, this one RSI trick might change everything. Let's go. All right, guys. Buckle up because what I'm about to show you is not in your average trading course. And honestly, it's kind of a cheat code. You've probably seen or heard of the RSI before. Yeah, that little wiggly line at the bottom... Read More
Key Insights
- Trend lines can be drawn on the RSI itself, not only on price. During an uptrend you connect the swing lows on the RSI, and during a downtrend you connect the swing highs, which builds a momentum line described as a speedometer for the market.
- An RSI trend line break is usually the first sign that the current trend is about to end and a new one is about to begin. The signal can appear while price has not reacted yet, which puts the trader ahead of the crowd.
- RSI is normally treated as a lagging indicator that reacts after the market has already moved, meaning signals arrive late. Using RSI trend line breakouts turns it into a leading signal that flags a momentum shift before price moves.
- Leading signals are powerful but tricky and can fake traders out. Following every RSI breakout blindly without confirmation is described as a one-way trip to blowing an account, so signals need filtering rather than automatic execution.
- The recommended filter is price action context: check support and resistance zones, confirm the overall trend direction, and only take RSI signals that match the flow of the market. RSI acts as the radar while price action serves as the map.
- Trading against the trend on an RSI break is a common mistake. In an uptrend with higher highs and higher lows, only buy signals are taken; in a downtrend with lower highs and lower lows, only sell setups are considered.
- Stop losses should sit at market structure rather than just above the breakout candle. Place the stop above the most recent swing high when selling, or below the most recent swing low when buying, so the stop is protected by actual structure.
- An RSI trend line is only valid when the RSI clearly shows a formation of swing highs or swing lows with a real slope. Fake-outs where RSI briefly pops above the line and falls back do not invalidate the structure if the swing highs stay aligned in a descending pattern.
Install to Summarize YouTube Videos and Get Transcripts
Explore YouTube Video Summarizer or Get YouTube Transcript Extractor
Questions & Answers
Q: How do you draw a trend line on the RSI?
You connect the swing points on the RSI line itself rather than on price. During an uptrend, connect the swing lows on the RSI. During a downtrend, connect the swing highs. What this builds is a momentum line, described as a speedometer for the market, that shows how momentum is sloping over time. The resulting line should be a clean diagonal that cuts through real structure, not a line drawn through random wiggles wherever it looks convenient.
Q: What does it mean when RSI breaks its trend line?
A break of the RSI trend line is usually the first sign that the current trend is about to end and a brand new one is about to begin. Because RSI measures momentum, the break can occur while price has not visibly reacted yet, so the trader sees the shift before the crowd. The comparison used is a heartbeat that starts skipping or spiking, or an alert that arrives before the storm hits, giving time to set up a trade while others are still watching candles.
Q: Why is the RSI trend line break called a leading indicator?
Most people treat RSI as a lagging indicator that only reacts after the market has already made its move, which means any signal arrives late. RSI trend line breakouts flip that: the momentum shift shows up on the RSI before the price itself moves, so the signal appears ahead of the price action. It is compared to getting a text from the market announcing an upcoming move, though the video is clear this is mechanical, repeatable technical analysis and not a crystal ball.
Q: What makes an RSI trend line valid or invalid?
The rule given is simple: the RSI line must clearly show a formation of swing highs or swing lows. A clean series of lower swing highs on the RSI, matching a price downtrend, produces a valid downward trend line. If the RSI line has no clear swing highs or swing lows and no real slope, the line should be discarded and the setup not forced. Many beginners skip this check and then wonder why their signals do not work.
Q: How should you set a stop loss on an RSI trend line trade?
Do not place the stop just above the breakout candle, which is described as asking to get wrecked. Instead, place it above the most recent swing high if you are selling, or below the most recent swing low if you are buying. That way the stop sits behind actual market structure rather than an arbitrary level. In the worked buy example, the trader enters on the RSI break above a bearish trend line and sets the stop just below the most recent swing low.
Q: Should you trade RSI breaks against the prevailing trend?
No. Seeing price flying up, watching an RSI trend line break, and immediately slamming a sell order to bet against the market is called a big mistake and compared to playing roulette with your money. The approach taught is to trade with the trend: in an uptrend with higher highs and higher lows, only buy signals are taken, and in a downtrend with lower highs and lower lows, only sell setups that line up with the downward move are considered.
Q: What should you do when RSI gives a fake breakout?
In the example shown, the RSI pops above the trend line in the middle of the move and then drops right back below, which makes most beginners panic. The trend line is still valid because the overall swing highs remain perfectly aligned in a descending pattern, and structure is what matters rather than emotion. The trade is taken only when RSI truly breaks above the bearish trend line with momentum, which then serves as the buy signal.
Q: How can you quickly confirm the overall trend direction?
Add a long-term moving average to the chart. It instantly shows the overall direction, and taking only the trades that match the direction of that line is said to eliminate half your bad trades in ten seconds. This works alongside the price structure check of higher highs and higher lows for an uptrend or lower highs and lower lows for a downtrend, and alongside support and resistance zones, so RSI signals are always filtered through the larger market context.
Q: What RSI settings should you use for this strategy?
Most people apply the default RSI setting of 14 and stop there, which is described as fine for beginners but not enough for a pro. The advice is to test different RSI periods and find the one that gives the clearest signals for the specific market and time frame being traded, since not every market responds the same way to the same settings. The process starts by opening the chart for the market you want to trade on any time frame, whether 1 minute, 15 minute, or 4 hour.
Summary & Key Takeaways
-
Most traders use RSI only as an overbought/oversold switch above 70 or below 30, but trend lines can be drawn on the RSI line itself. Connect swing lows during an uptrend and swing highs during a downtrend to build a momentum line that works like a speedometer for the market.
-
A break of an RSI trend line is usually the first sign that the current trend is ending and a new one is starting, often before price has reacted. That leading quality also makes the signal prone to fake-outs, so RSI breaks should be combined with price action context: support and resistance zones and confirmed trend direction.
-
A valid RSI trend line requires a clear formation of swing highs or swing lows with a real slope; random wiggles do not count. Trade breaks in the direction of the larger trend, place stops above the most recent swing high when selling or below the most recent swing low when buying, and test RSI periods beyond the default 14.
Read in Other Languages (beta)
Share This Summary 📚
Summarize YouTube Videos and Get Video Transcripts with 1-Click
Try YouTube Summary with ChatGPT & Claude or YouTube Transcript Generator
Explore More Summaries from Trader DNA 📚




Summarize YouTube Videos and Get Video Transcripts with 1-Click
Try YouTube Summary with ChatGPT & Claude or YouTube Transcript Generator