How to Build an EMA Foundation for RSI and Stochastic Trade Entries
TL;DR
Build the strategy by testing EMA periods individually and choosing the line that price consistently respects on the specific chart and timeframe. The demonstration tests 20, 34, 50, 75, 100, 150, and 200, then uses 50, 110, and 250 EMAs as layered support. RSI and stochastic are intended to refine trend confirmation and entry timing, so read on for the complete setup logic.
Transcript
Welcome back to Trader DNA, the home of next level trading breakthroughs. In last week's video, I showed you something that could literally change the way you trade forever. How to set your EMA indicators with laser precision. So, almost every signal they generate becomes shockingly accurate. That video alone is worth millions in trading value if y... Read More
Key Insights
- The exponential moving average is described as a smart, smooth line that shows the direction of market momentum and filters out noise, letting a trader see what is happening beneath the surface of price action. Its usefulness depends entirely on choosing the right period.
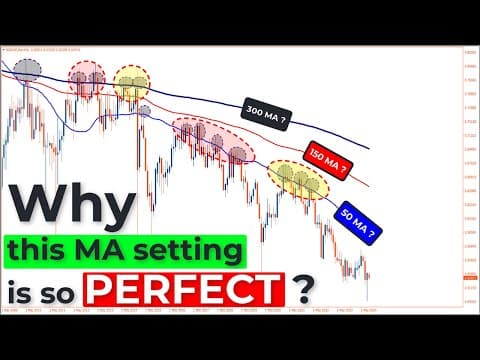
- Finding the correct EMA setting is done by testing rather than by copying: apply the 20, 34, 50, 75, 100, 150 and 200 in turn and observe which one produces clean rejections, consistent reactions and strong signals on that specific chart.
- In the case study presented, the 100 period EMA was the setting price respected repeatedly, bouncing off it over and over. That result is explicitly limited to that chart and timeframe rather than treated as a universal number.
- There is no one-size-fits-all EMA because different markets behave differently and different timeframes have a different rhythm. The presenter says a setting must be customized and adapted intentionally to the market being analyzed.
- The 50 EMA functions as the first line of defense on the demonstrated chart, with price dropping into it and bouncing back up repeatedly, described as an invisible launch pad that gives a prepared trader a signal to get ready to act.
- The 110 period EMA acts as the second safety net behind the 50. When the 50 breaks, the presenter directs attention immediately to the 110, since a chart respecting two major levels is showing structure rather than random behavior.
- The 250 EMA is the final support zone, preferred over the widely discussed 200 because testing showed it working on this chart. Price hitting it produces an instant reaction, and the level marks where momentum either recovers or flips.
- The escalation rule is simple: if the 50 breaks focus on the 110, if the 110 breaks shift to the 250, and if the 250 breaks the entire uptrend may be finished with a bearish trend starting. This logic can be coded into an expert advisor or alert system.
Install to Summarize YouTube Videos and Get Transcripts
Explore YouTube Video Summarizer or Get YouTube Transcript Extractor
Questions & Answers
Q: How do you find the best EMA setting for a chart?
Test EMA periods one at a time and observe whether price produces clean bounces, rejections, and consistent reactions around each line. The demonstrated sequence is 20, 34, 50, 75, 100, 150, and 200; in the case study, the 100-period EMA stood out.
Q: What does an EMA show traders?
The exponential moving average is presented as a smooth line that indicates the direction of market momentum. It filters out price noise, helping traders see the underlying movement more clearly.
Q: Why is there no single best EMA period for every market?
Different markets behave differently, and each timeframe has its own rhythm. Although the 100-period EMA worked in the case study, the presenter says traders must test and adapt the setting to their own chart rather than copy a universal number.
Q: How do the 50, 110, and 250 EMAs work together?
They form three layers of potential support in the demonstrated setup. The 50 EMA is the first line of defense, the 110 is the second safety net, and the 250 is the final support zone.
Q: What should traders watch after price breaks the 50 EMA?
Attention shifts to the 110-period EMA, where the next bounce may occur. If price also breaks the 110, the setup directs traders to watch the 250 EMA.
Q: Why does the demonstrated setup use the 250 EMA instead of the 200 EMA?
The 250 EMA is used because testing showed that price respected it on the demonstrated chart and timeframe. When price moved below the 110 EMA, it reached the 250 and reacted there.
Q: What does a break below the 250 EMA indicate?
A break of the 250 EMA warns that the existing uptrend may be ending and a bearish trend may be beginning. It is the final level in the sequence after the 50 and 110 EMAs have already failed.
Q: How are RSI and the stochastic oscillator intended to improve trade entries?
They are introduced as tools for confirming the trend, identifying the strongest trending conditions, and refining entry timing. The presenter plans to combine them with the moving-average foundation to pursue entries with low risk and stated risk-reward ratios of 1:5 or 1:10.
Summary & Key Takeaways
-
The video builds a trading setup starting from the exponential moving average, described as a smoothed line showing the direction of market momentum while filtering out noise. The presenter stresses that the EMA only works if the right period is chosen, and that picking a setting because an influencer suggested it is gambling rather than trading.
-
Finding the right EMA is presented as a testing process: apply 20, then 34, 50, 75, 100, 150 and 200, and watch how price behaves around each line. In the case study shown, the 100 period EMA stood out with clean rejections and repeated bounces, which the presenter treats as confirmation for that chart and timeframe.
-
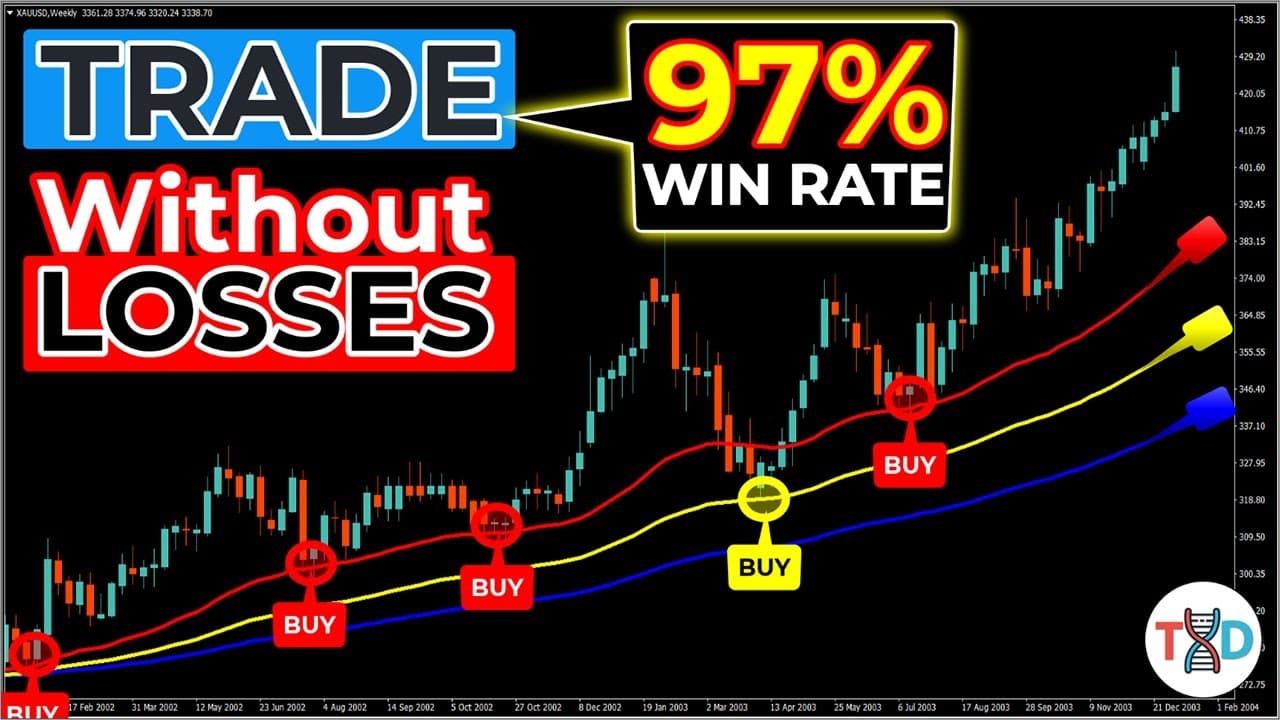
A second chart demonstrates three moving average lines, blue, red and yellow, acting like force fields where price pauses, reverses or explodes away. The 50 EMA is called the first line of defense, repeatedly launching price back up like a trampoline after each drop.
-
The 110 period EMA is introduced as the backup shield or second safety net, compared to a second layer of armor in a video game. When the 50 EMA breaks, the presenter says attention should immediately shift to the 110, because that is where the next bounce is expected.
-
The 250 EMA is the final support zone in the sequence, chosen over the more commonly discussed 200 because testing on that chart showed it working. Price falling through the 110 travels to the 250 and reacts there, and a break of the 250 is treated as a warning that a bearish trend may be beginning.
-
The presenter frames the layered EMA rule as a repeatable blueprint that can be programmed into a robot, an expert advisor or an alert system so the strategy runs 24/7. The stated next step is combining EMA with the RSI and stochastic oscillator to identify the strongest trending conditions and entries with claimed risk reward ratios of 1:5 or 1:10.
Read in Other Languages (beta)
Share This Summary 📚
Summarize YouTube Videos and Get Video Transcripts with 1-Click
Try YouTube Summary with ChatGPT & Claude or YouTube Transcript Generator
Explore More Summaries from Trader DNA 📚

Summarize YouTube Videos and Get Video Transcripts with 1-Click
Try YouTube Summary with ChatGPT & Claude or YouTube Transcript Generator