How to Identify Key Candlestick Patterns for Trading
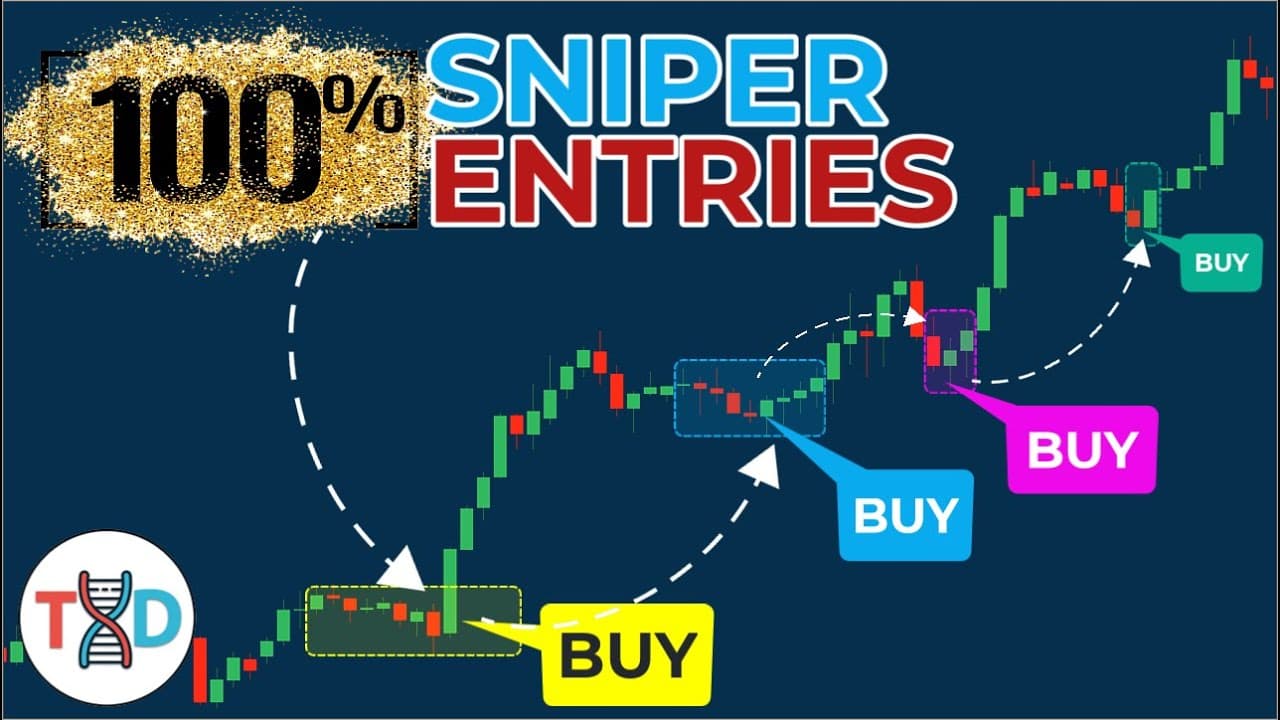
TL;DR
Understanding candlestick patterns is essential for successful trading. Each pattern, such as the bullish and bearish pin bars or the morning and evening stars, provides insights into market momentum and potential reversals. By combining these patterns with other market indicators like support and resistance levels, traders can make more informed decisions and increase their chances of successful trades.
Transcript
In today's video, we're going allin. Uh we're going to reveal the top seven candlestick patterns that every trader should know. From the most basic patterns that beginners can use right away all the way up to advanced setups that professional traders rely on every single day to make smarter, more confident trades. All right, hold up. Before we jump... Read More
Key Insights
- Candlesticks provide a visual representation of price movement over a specific period.
- A green candle indicates a price increase, while a red candle indicates a price decrease.
- The size of a candlestick's body and its wicks reveal the battle between buyers and sellers.
- Long wicks suggest strong resistance or support levels, indicating potential market reversals.
- The bullish pin bar signals a potential upward reversal after a downtrend.
- The bearish pin bar indicates a potential downward reversal following an uptrend.
- The morning star pattern is a bullish reversal signal, while the evening star is bearish.
- Combining candlestick patterns with support and resistance levels enhances trading accuracy.
Install to Summarize YouTube Videos and Get Transcripts
Explore YouTube Video Summarizer or Get YouTube Transcript Extractor
Questions & Answers
Q: How do candlesticks represent price movement?
Candlesticks visually represent price movement over a specific period. A green candle indicates that the closing price is higher than the opening price, showing an upward trend. Conversely, a red candle shows that the closing price is lower than the opening price, indicating a downward trend. The body of the candlestick represents the range between the open and close, while the wicks show the highest and lowest prices during that period.
Q: What does a large wick on a candlestick indicate?
A large wick on a candlestick suggests significant resistance or support at certain price levels. For a large wick above the body, it indicates that sellers pushed the price down after buyers tried to increase it, suggesting selling pressure. Conversely, a large wick below the body shows that buyers stepped in to push the price up after sellers attempted to lower it, indicating buying pressure. These wicks signal potential market reversals.
Q: What is a bullish pin bar, and how is it used in trading?
A bullish pin bar is a candlestick pattern that signals a potential reversal from a downtrend to an uptrend. It features a small green body near the top and a long wick extending below. The pattern suggests that buyers have gained control after a period of selling pressure. Traders use the bullish pin bar to identify potential buying opportunities, especially when it forms at key support levels or is confirmed by other indicators.
Q: How does a bearish pin bar signal market changes?
A bearish pin bar indicates a potential reversal from an uptrend to a downtrend. It has a small red body near the bottom and a long wick extending above. This pattern suggests that sellers have taken control after buyers initially pushed the price higher. Traders look for bearish pin bars at resistance levels or in conjunction with other signals to identify potential selling opportunities and anticipate market declines.
Q: What is the significance of the morning star pattern?
The morning star pattern is a bullish reversal signal consisting of three candles: a large red candle, a small indecisive candle (often a doji), and a large green candle. It indicates a shift from bearish to bullish sentiment, suggesting that buyers are gaining control. Traders use this pattern to identify potential upward reversals, especially when it appears at key support levels or is supported by other indicators.
Q: How can the evening star pattern be used in trading?
The evening star pattern is a bearish reversal signal made up of three candles: a large green candle, a small doji or indecisive candle, and a large red candle. It signifies a transition from bullish to bearish sentiment, indicating that sellers are taking control. Traders use the evening star pattern to spot potential downward reversals, particularly when it forms at resistance levels or is confirmed by other technical indicators.
Q: Why is it important to combine candlestick patterns with other indicators?
Combining candlestick patterns with other indicators, such as support and resistance levels or trend lines, enhances trading accuracy. While candlestick patterns provide valuable insights into market sentiment and potential reversals, additional indicators offer confirmation and context. This integrated approach helps traders make more informed decisions, reducing the risk of false signals and increasing the likelihood of successful trades.
Q: How can traders improve their success using candlestick patterns?
Traders can improve their success by thoroughly understanding candlestick patterns and integrating them with other market indicators. Recognizing key patterns like pin bars and engulfing bars helps identify potential reversals. By also considering support and resistance levels, trend lines, and volume spikes, traders can confirm signals and enhance their strategies, leading to more accurate predictions and better trading outcomes.
Summary & Key Takeaways
-
Candlestick patterns are crucial tools for traders, offering insights into market trends and potential reversals. Key patterns like the bullish pin bar and morning star indicate shifts in market momentum, signaling potential buying opportunities. By understanding these patterns, traders can better predict market movements and improve their trading strategies.
-
The size and shape of candlesticks, including their bodies and wicks, provide valuable information about the strength and direction of market forces. Long wicks often indicate strong resistance or support, suggesting possible trend reversals. Recognizing these signals helps traders make more informed decisions.
-
Successful trading involves combining candlestick patterns with other market indicators such as support and resistance levels. This approach allows traders to confirm signals and make more accurate predictions. By integrating these techniques, traders can enhance their strategies and increase the likelihood of profitable trades.
Read in Other Languages (beta)
Share This Summary 📚
Summarize YouTube Videos and Get Video Transcripts with 1-Click
Try YouTube Summary with ChatGPT & Claude or YouTube Transcript Generator
Explore More Summaries from Trader DNA 📚

Summarize YouTube Videos and Get Video Transcripts with 1-Click
Try YouTube Summary with ChatGPT & Claude or YouTube Transcript Generator