How to Set Accurate EMA for Winning Trades
TL;DR
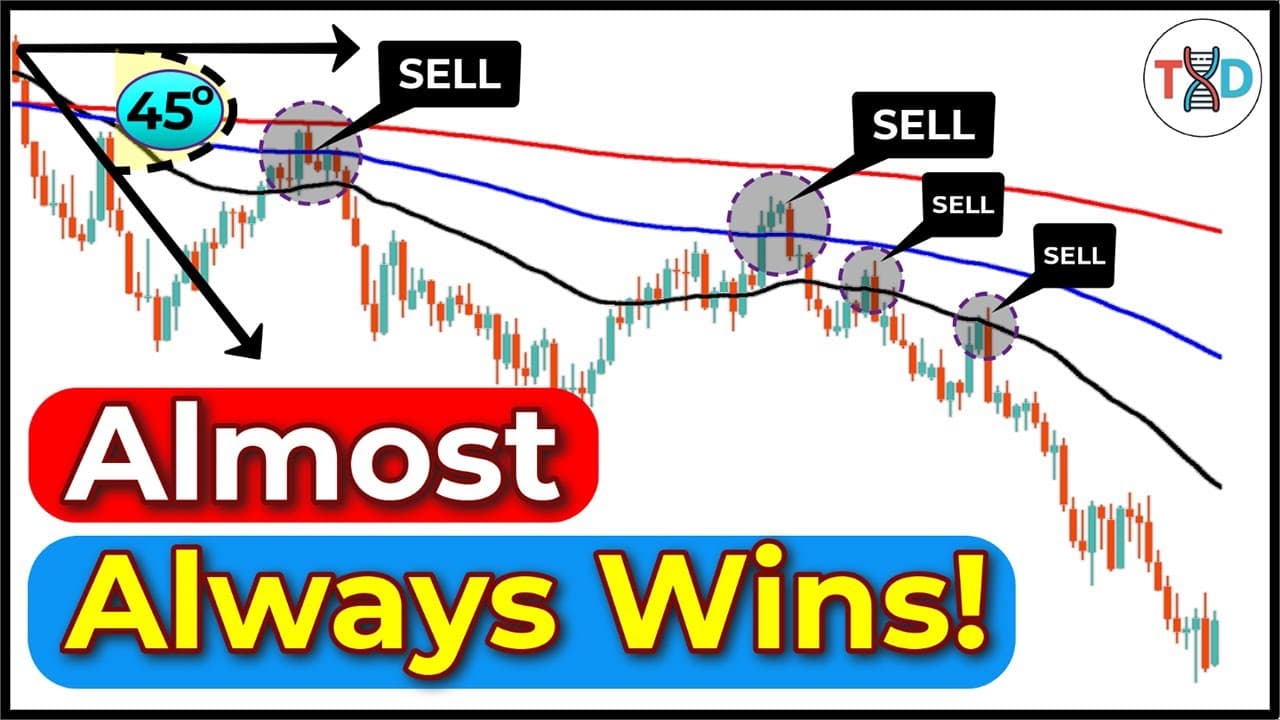
Accurate EMA settings are found by testing for the period that price consistently respects through bounces, rejections, and trend-changing breaks. The strategy then combines that EMA with the Commodity Channel Index (CCI) and MACD: CCI highlights trend strength and possible reversals around zero, 100, and minus 100, while MACD provides confirmation. Read on for the specific signals and roles of all three indicators.
Transcript
Welcome back to Trader DNA and today you're about to witness one of the most mindblowing trading systems that every serious trader has been waiting for. I'm not joking. This strategy is absolutely insane. We're combining three powerful indicators. The exponential moving average EMA, the commodity channel index CCI, and the MAT CD. And together, the... Read More
Key Insights
- The EMA is a critical tool for identifying market trends and potential reversals.
- Correct EMA settings can act as a trend detector, offering high accuracy in trade decisions.
- The CCI indicator helps identify overbought and oversold conditions, enhancing trade timing.
- Combining EMA, CCI, and MACD provides a comprehensive strategy for market analysis.
- The MACD histogram can confirm trend strength, preventing premature trade exits.
- Testing different EMA periods is essential to find the best fit for specific market conditions.
- EMA settings must be tailored to individual markets and time frames for optimal results.
- Using multiple indicators reduces reliance on guesswork, improving trading confidence.
Install to Summarize YouTube Videos and Get Transcripts
Explore YouTube Video Summarizer or Get YouTube Transcript Extractor
Questions & Answers
Q: How do you choose accurate EMA settings for trading?
Test different EMA periods on the specific market and time frame you trade, then observe how price reacts to each line. Look for the EMA that price consistently respects through clear bounces, rejections, or breaks rather than copying an untested setting.
Q: How does the EMA identify bullish and bearish trend changes?
A break above the EMA indicates that the trend may be turning bullish, while a drop through it indicates a possible bearish shift. After the shift, repeated bounces near the EMA can show that price continues to respect the new trend direction.
Q: Why should EMA settings be tailored to each market and time frame?
The page explains that traders should test EMA periods to find the setting respected by the particular market. This avoids assuming that one setting will deliver the same behavior in every market and time frame.
Q: What does the CCI indicator measure?
The Commodity Channel Index helps assess trend strength and where the market may reverse by tracking how far price moves from its average. On the chart, its line oscillates above and below a zero center line.
Q: What do the CCI levels of 100 and minus 100 mean?
A CCI reading above 100 warns that the market may be overbought and that a reversal could follow. A reading below minus 100 suggests oversold conditions and a possible bounce.
Q: How is CCI different from RSI?
The transcript says RSI measures momentum based on price changes. CCI instead focuses on how far price has moved from its average, helping traders evaluate trend strength and potential turning points.
Q: Why combine EMA, CCI, and MACD in one trading strategy?
The EMA establishes trend direction and highlights bounces or breaks, while CCI helps identify trend strength, overbought or oversold conditions, and possible reversals. MACD is then used as confirmation, giving the strategy multiple signals for judging entries and changing market direction.
Q: Who created the CCI indicator, and when?
Donald Lambert created the CCI in 1980 to track trends in commodities. The transcript says traders later applied it across markets and time frames for both trend-following and reversal strategies.
Summary & Key Takeaways
-
Using the correct Exponential Moving Average (EMA) settings is key to successful trading. Combining EMA with indicators like CCI and MACD helps traders identify trends and entry points. This method enhances accuracy and profitability by providing clear signals based on market behavior.
-
The Commodity Channel Index (CCI) detects overbought and oversold conditions, acting as an early warning system for potential market shifts. When combined with EMA, it allows traders to time their trades with greater precision and confidence.
-
The MACD histogram serves as a confirmation tool, indicating whether a trend is still strong. By analyzing the position of the histogram bars, traders can avoid false signals and make informed decisions about entering or exiting trades.
Read in Other Languages (beta)
Share This Summary 📚
Summarize YouTube Videos and Get Video Transcripts with 1-Click
Try YouTube Summary with ChatGPT & Claude or YouTube Transcript Generator
Explore More Summaries from Trader DNA 📚




Summarize YouTube Videos and Get Video Transcripts with 1-Click
Try YouTube Summary with ChatGPT & Claude or YouTube Transcript Generator