How to Understand AP Human Geography Unit 1
TL;DR
Geographers interpret spatial patterns by using maps to show where phenomena are located, distributed, and related across space. Effective map reading requires understanding scale, direction, reference and thematic maps, projection trade-offs, and quantitative versus qualitative data. Every flat world map introduces distortion, so its accuracy must be judged according to its intended purpose.
Transcript
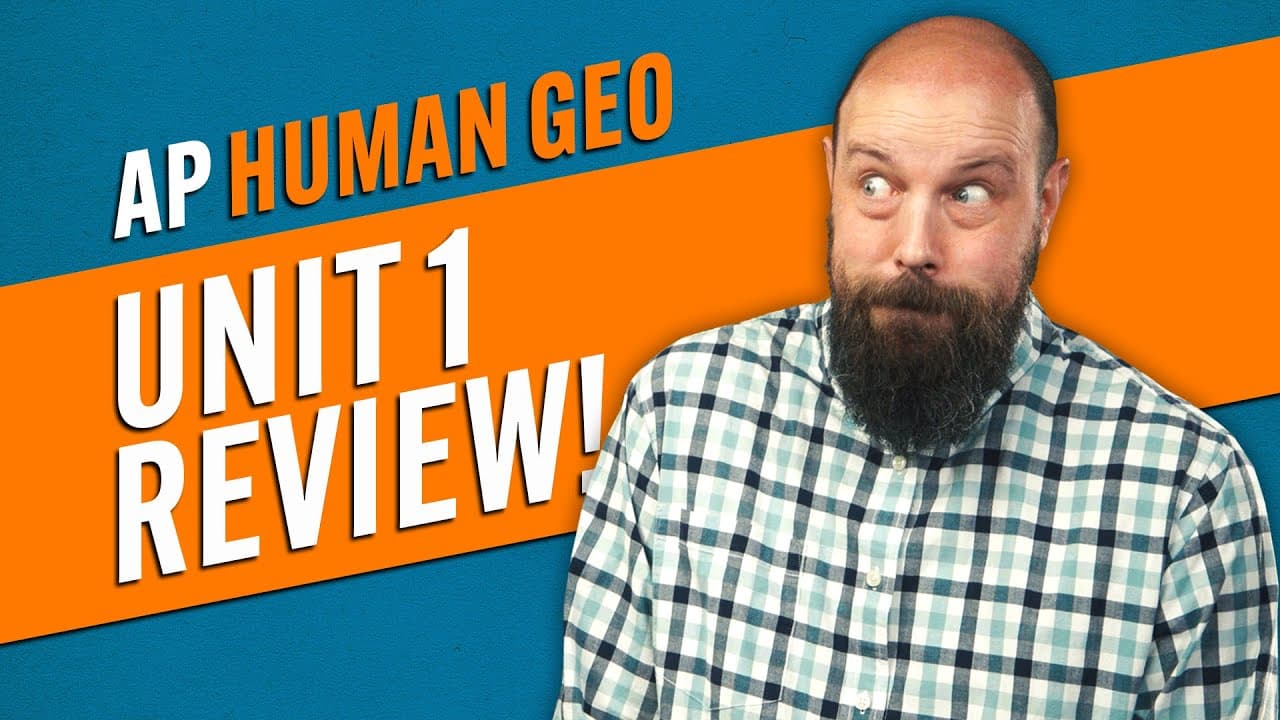
so your AP Human Geography unit one exam is coming up and you're sweating like a dog trying to bury a turd on a marble floor but hey what if I told you that it's not as complicated as you think and by the end of this video you'll have everything you need to crush that exam well my name is Steve heimler and if you're ready to get them brain cows mil... Read More
Key Insights
- Spatial patterns describe where phenomena are located on Earth. Geographers use maps to examine patterns involving physical features, transportation networks, population groups, and other things that exist, making maps one of their most important tools for interpreting geographic space.
- Absolute distance is measured with units such as inches, feet, miles, or kilometers, while relative distance reflects social, cultural, or political similarities and differences. Two neighborhoods can therefore be physically close but relatively distant because their socioeconomic characteristics differ.
- Absolute direction identifies north, south, east, and west, while relative direction locates something in relation to something else. A place may be geographically north of a city even when a traveler informally describes the journey as going down to that city.
- Clustering and dispersal describe how phenomena are distributed across an area. Clustered phenomena are located close together, while dispersed phenomena have more space between them. Elevation is another spatial pattern, measuring a geographic feature's height relative to sea level.
- Map scale explains how distance on a map corresponds to distance in the real world. Large-scale maps zoom in on particular features and show large details, while small-scale maps zoom out to national or global levels and depict details at a smaller size.
- Reference maps display specific geographic locations, including roads, highways, mountains, valleys, and political boundaries. Thematic maps instead represent geographic information spatially, allowing readers to identify patterns in data rather than simply determine where particular features are located.
- Thematic maps encode data through several visual methods. Choropleth maps use colors, dot distribution maps use dots, graduated symbol maps vary symbol size, isoline maps connect related values with lines, and cartograms distort geographic shapes according to the represented data.
- Every flat map contains distortion because Earth is spherical and a map is two-dimensional. Mercator preserves direction but enlarges land farther from the equator, Peters preserves land-area size while altering shapes, polar projections distort edges, and Robinson distributes distortion more evenly.
Install to Summarize YouTube Videos and Get Transcripts
Explore YouTube Video Summarizer or Get YouTube Transcript Extractor
Questions & Answers
Q: What are spatial patterns in human geography?
Spatial patterns describe where phenomena are located on Earth and how those phenomena relate across geographic space. The phenomena can include mountains, highways, population groups, neighborhoods, or other things that exist. Geographers use maps to recognize and interpret these patterns, including distance, direction, clustering, dispersal, and elevation, because location is a central concern of geographic analysis.
Q: What is the difference between absolute and relative distance?
Absolute distance is a measurable separation between two locations, expressed with units such as inches, feet, miles, or kilometers. Relative distance describes social, cultural, or political differences or similarities between places. For example, two neighborhoods may be only one mile apart in absolute terms but have greater relative distance when one is mainly upper middle class and the other mainly lower class.
Q: What is the difference between large-scale and small-scale maps?
A large-scale map is zoomed in on a particular feature, so geographic details appear large. A small-scale map is zoomed out to a national or global level, making individual details appear small. One way to remember the distinction is that large-scale maps show large buildings, while small-scale maps show small buildings because they cover a broader geographic area.
Q: How do reference maps differ from thematic maps?
Reference maps display the locations of specific geographic features. Road maps show roads and highways, topographic maps show mountains, valleys, and elevation changes, and political maps show state, provincial, or national boundaries. Thematic maps display geographic information or data spatially, helping readers examine a selected phenomenon rather than simply locate physical or political features.
Q: What are the main types of thematic maps?
The five thematic map types presented are choropleth, dot distribution, graduated symbol, isoline, and cartogram maps. Choropleth maps use colors, dot maps represent data with dots, graduated symbol maps change symbol size in proportion to data, isoline maps use lines, and cartograms distort the sizes of geographic shapes to communicate differences in a selected variable.
Q: How do isoline maps show changes in geographic data?
Isoline maps use lines to depict geographic data. Lines positioned close together indicate that the represented value changes rapidly across a short distance, while lines spaced farther apart indicate a more gradual change. On a topographic map, closely spaced lines show sharply rising elevation, whereas widely spaced lines show elevation increasing more gradually across the landscape.
Q: Why is every flat map projection distorted?
Every flat map is distorted because Earth is a three-dimensional sphere, while a flat map has only two dimensions. Converting between those forms necessarily produces inaccurate sizes, shapes, directions, or edges somewhere on the map. Projection designers therefore choose trade-offs according to a map's purpose, deciding which properties should remain accurate and where distortion is acceptable.
Q: How do Mercator, Peters, polar, and Robinson projections differ?
The Mercator projection has latitude and longitude lines meeting at right angles and preserves true direction, but landmasses become increasingly distorted farther from the equator. Peters represents landmasses at their true relative sizes but changes their shapes. Polar projections preserve direction while distorting their edges. Robinson spreads multiple kinds of distortion more evenly as a compromise.
Summary & Key Takeaways
-
Geographers use maps to analyze spatial patterns, meaning the locations of phenomena across Earth. Important patterns include absolute and relative distance, absolute and relative direction, clustering and dispersal, and elevation. These concepts distinguish measurable geographic relationships from social, cultural, political, or relational differences between locations.
-
Every map includes features that help readers interpret space. Scale connects map distance to real-world distance, while a compass rose indicates direction. Large-scale maps zoom in and show large details, whereas small-scale maps zoom out to national or global levels and display geographic features as smaller details.
-
Reference maps identify locations such as roads, political boundaries, mountains, and valleys. Thematic maps display geographic data through choropleth colors, distribution dots, graduated symbols, isolines, or distorted cartogram shapes. Map projections also involve trade-offs because transferring a spherical Earth onto a flat surface necessarily distorts some geographic properties.
Read in Other Languages (beta)
Share This Summary 📚
Summarize YouTube Videos and Get Video Transcripts with 1-Click
Try YouTube Summary with ChatGPT & Claude or YouTube Transcript Generator
Explore More Summaries from Heimler's History 📚

Summarize YouTube Videos and Get Video Transcripts with 1-Click
Try YouTube Summary with ChatGPT & Claude or YouTube Transcript Generator