How to Build the Ultimate Data Analytics Capstone Project (2026) with Power BI, SQL, Excel, and Tableau
TL;DR
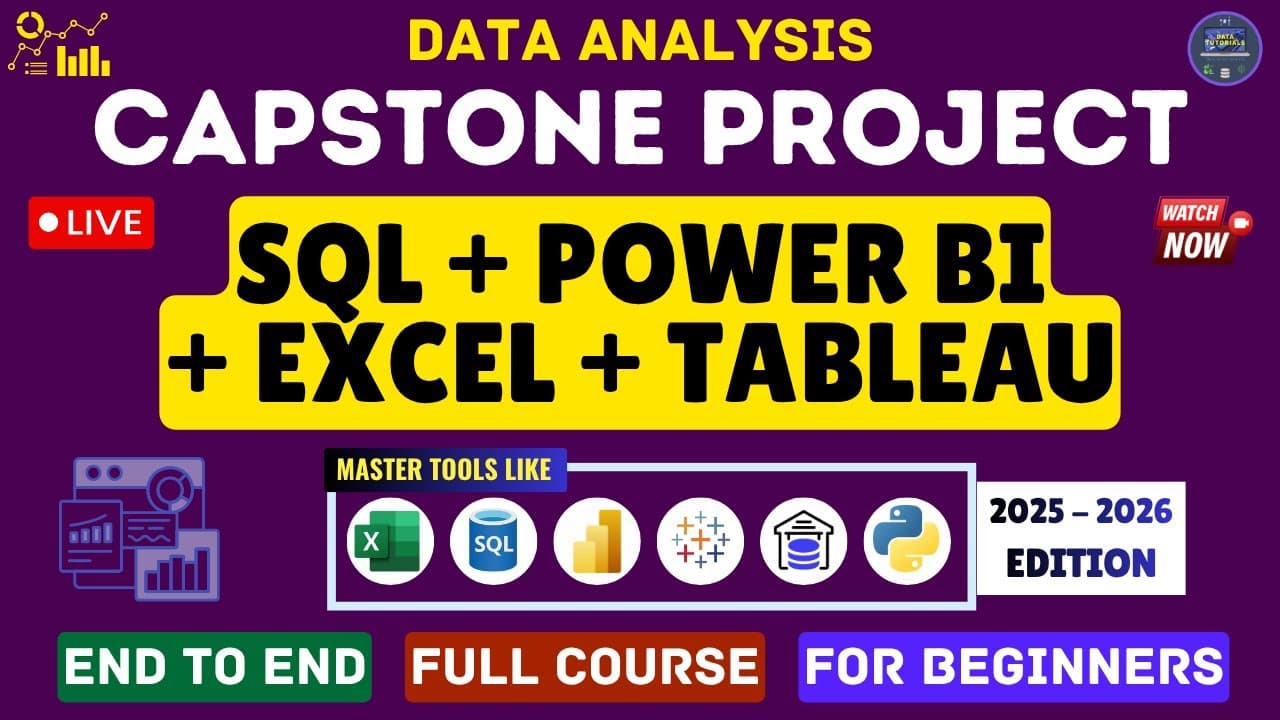
Build a complete data analytics capstone project by creating and validating the same dashboard with Power BI, Tableau Desktop, SQL, and Excel. The project progresses from beginner to advanced work, covering KPIs, charts, DAX queries, LOD calculations, SQL queries, date tables, pivot tables, filters, and conditional formatting. Read on to see how each tool contributes to a portfolio-ready end-to-end project.
Transcript
Hey guys, welcome back to my channel. So in today's video we are going to see the data analyst portfolio project and this will be a complete start to end build and in this we are going to make use of four data analysis tools that is PowerBI, Tableau Desktop, SQL and Excel. And this everything will be in one single video. In each and every tool we a... Read More
Key Insights
- A data analytics capstone project involves integrating tools like Power BI, SQL, Excel, and Tableau.
- Begin with requirement gathering and identifying stakeholders to ensure project relevance.
- Data cleaning and modeling in Power BI are crucial for accurate analysis and visualization.
- Creating a dynamic dashboard involves designing KPIs and visualizations that reflect data insights.
- Using Power BI's Power Query, users can perform data cleaning and transformations efficiently.
- The project helps in building a strong portfolio by showcasing advanced data analysis skills.
- Understanding data through metadata analysis is critical before starting visualization.
- Creating a calendar table in Power BI aids in performing time intelligence calculations effectively.
Install to Summarize YouTube Videos and Get Transcripts
Explore YouTube Video Summarizer or Get YouTube Transcript Extractor
Questions & Answers
Q: How do you build a complete data analytics capstone project?
Build the project from start to finish with Power BI, Tableau Desktop, SQL, and Excel. Create dashboards in the visualization tools, solve business problems with SQL queries, and compare the results across the tools before submitting the work to the client.
Q: Which tools are used in this data analytics portfolio project?
The project uses four data analysis tools: Power BI, Tableau Desktop, SQL, and Excel. The SQL portion uses an MSSQL Server database, while the dashboards are developed in Power BI, Tableau Desktop, and Excel.
Q: What does the Power BI portion of the project cover?
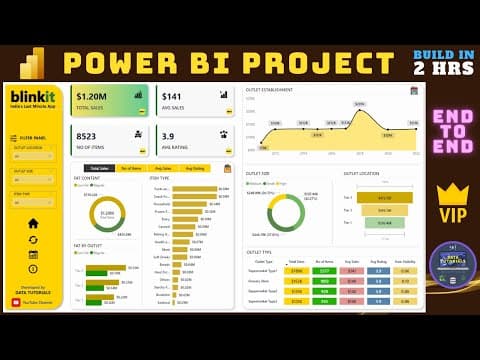
The Power BI portion builds the displayed dashboard step by step, including every visible element. It covers different sets of KPIs, secondary KPIs, charts, DAX queries, date tables, backgrounds, and conditional formatting.
Q: What does the Tableau Desktop portion teach?
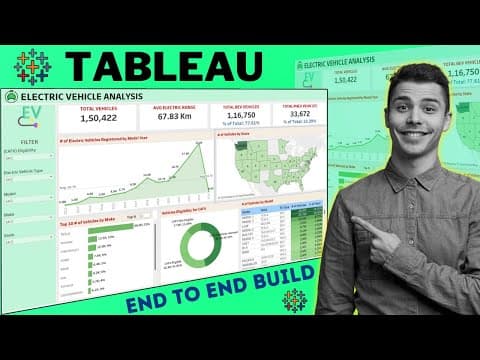
The Tableau Desktop portion recreates the dashboard with charts, interactive filters, quick filters, sparklines, and KPIs. It also covers calculating year-over-year growth and using LOD calculations.
Q: How is SQL used to validate the dashboards?
SQL queries are used to solve business problems and check the values shown in the Power BI, Tableau, and Excel dashboards. If the results match, the work can be submitted to the client; if they do not, the mismatch signals that something may be wrong in a dashboard.
Q: Which SQL concepts are included in the project?
The SQL work progresses from basic to advanced queries. It includes case functions, decimal functions, GROUP BY, ORDER BY, WHERE clauses, and other functions, and the queries can be used with databases beyond MSSQL Server.
Q: What does the Excel portion of the project cover?
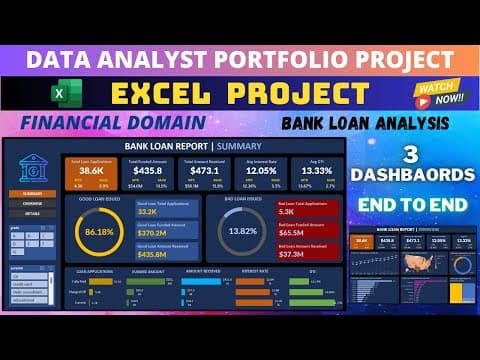
The Excel portion recreates the same dashboard step by step. It covers pivot tables, data summarization, functions, chart design, chart formatting, and the formatting used to produce the final dashboard.
Q: Which software versions are used for the capstone project?
The project uses Windows 11 with a 64-bit operating system, Power BI 2.118 from the June 2023 release, Tableau Desktop 2022.3.0, MSSQL Server Management Tool 19.2, and Excel 2021. For Excel, the presenter recommends using the 2019 or 2021 version to obtain the expected result.
Summary & Key Takeaways
-
To build a data analytics capstone project, integrate Power BI, SQL, Excel, and Tableau, starting with requirement gathering and stakeholder identification. Design dynamic dashboards with KPIs to analyze data trends.
-
Clean and model data using Power BI's Power Query, ensuring accurate analysis. This project enhances your portfolio, showcasing advanced data analysis skills and improving your chances of getting interview calls.
-
The project involves designing a comprehensive dashboard, creating KPIs, and performing time intelligence calculations using a calendar table, providing valuable insights and aligning with client goals.
Read in Other Languages (beta)
Share This Summary 📚
Summarize YouTube Videos and Get Video Transcripts with 1-Click
Try YouTube Summary with ChatGPT & Claude or YouTube Transcript Generator
Explore More Summaries from Data Tutorials 📚
Summarize YouTube Videos and Get Video Transcripts with 1-Click
Try YouTube Summary with ChatGPT & Claude or YouTube Transcript Generator