How to Optimize Facebook Ads Using Click Data
TL;DR
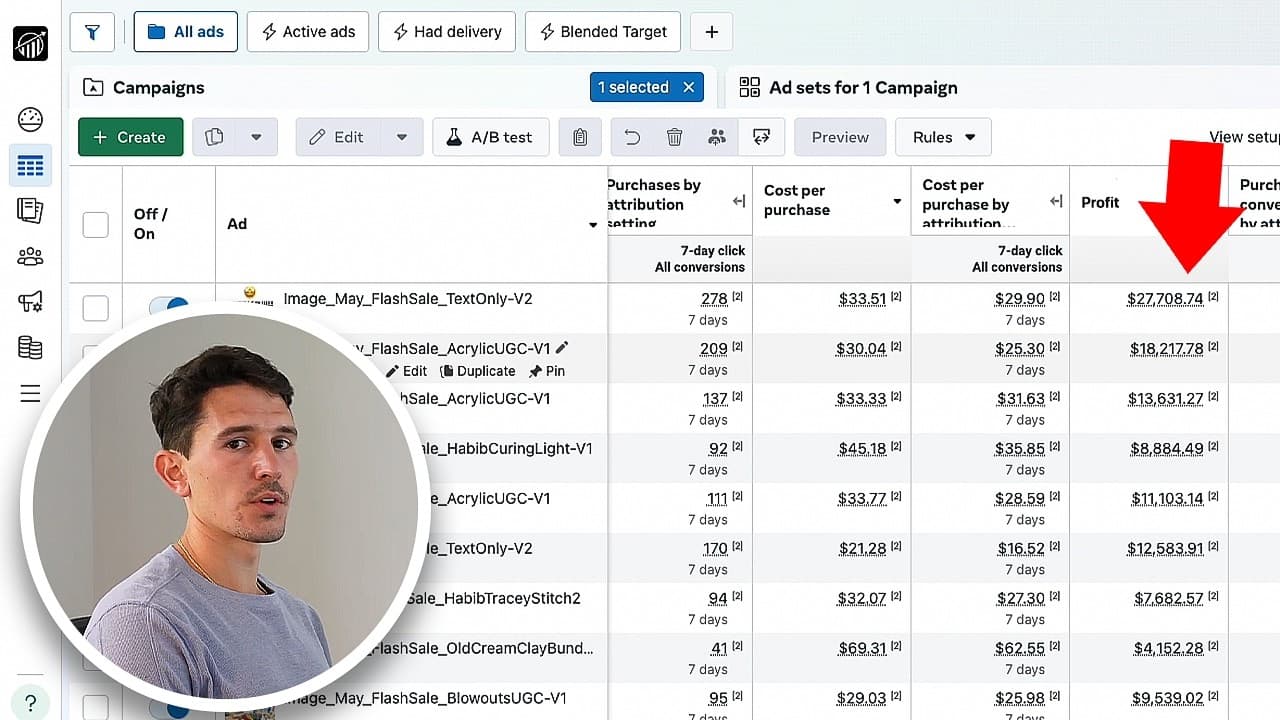
Optimize Facebook ad budgets using 7-day click conversions rather than blended results that include 1-day view conversions. Build a consistent custom column set, compare attribution settings, and move roughly 10–20% of budget from weaker click-driven campaigns into stronger ones every few days, allowing performance to rebalance before making another adjustment.
Transcript
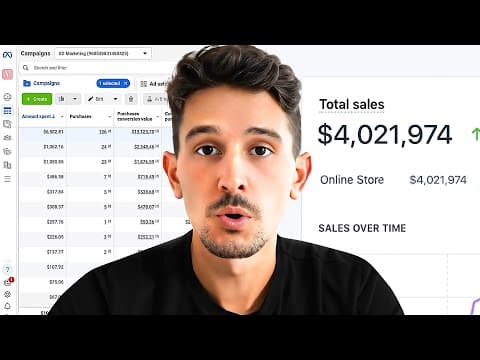
in the last 30 days this e-commerce business spent $ 76,7 63 on Facebook ads to drive $239,000 in Revenue that's a 3.82 return on ad spend at scale better yet they did all of this with a $47 cost per acquisition today's video I'm going to break down how I've optimized this account and how I'm checking on it on a regular basis this is not going to b... Read More
Key Insights
- The reporting column set is the foundation of optimization because it keeps delivery status, attribution, spending, conversions, revenue, traffic costs, audience exposure, and early purchase signals visible across campaigns, ad sets, and ads.
- Delivery status is an operational warning system that shows campaign problems and indicates whether campaigns, ad sets, or ads are active or still learning. Hovering over learning status can also reveal progress toward completing the learning phase.
- Amount spent is the first performance metric to examine because optimization begins by identifying where advertising money is flowing. Campaign-level spending should be reviewed before investigating how results divide among ad sets and individual ads.
- Frequency is impressions divided by reach and represents the average number of times someone saw an ad. It helps identify repeated audience exposure and distinguish higher-frequency retargeting activity from prospecting campaigns intended to reach new people.
- Cost per add-to-cart is an early directional signal rather than a final success measure. A low cost per add-to-cart often corresponds with a low cost per purchase, but advertisers with limited spending should not treat add-to-carts alone as proof of success.
- View-through attribution can overstate an ad's influence because Facebook or Instagram may show an ad shortly before a purchase and receive credit even when the person only scrolled past it without a meaningful interaction.
- Click attribution provides stronger evidence of influence because the person clicked or engaged with the ad before purchasing. The recommended optimization view separates 7-day click conversions from 1-day view conversions instead of relying only on blended totals.
- Budget reallocation should occur gradually in roughly 10–20% increments every few days. Money should move from campaigns with weaker 7-day click cost per purchase or return on ad spend into campaigns with stronger click-based performance until results rebalance.
Install to Summarize YouTube Videos and Get Transcripts
Explore YouTube Video Summarizer or Get YouTube Transcript Extractor
Questions & Answers
Q: How should I optimize Facebook ad campaign budgets?
Start at the campaign level and identify where the money is going. Compare attribution settings so that 7-day click conversions and 1-day view conversions appear separately. Evaluate campaigns primarily through click-based cost per purchase or return on ad spend, then move roughly 10–20% of the budget from weaker click performers into stronger ones every few days until results balance again.
Q: Which Facebook Ads Manager columns should I use?
Use columns for on-off status, campaign, delivery, attribution setting, bid strategy, budget, amount spent, purchases, cost per purchase, purchase conversion value, purchase return on ad spend, link click-through rate, cost per link click, CPM, impressions, reach, frequency, add-to-carts, and cost per add-to-cart. Apply the same column view across campaigns, ad sets, and ads for consistent analysis.
Q: Why should Facebook ads be optimized using click conversions?
Click conversions provide clearer evidence that a person interacted with an ad before purchasing. A view conversion can be credited after someone briefly scrolls past an ad shortly before buying, even when the ad had little influence. Separating and prioritizing 7-day click data therefore produces a more defensible basis for comparing campaigns and reallocating budgets.
Q: What is the difference between 7-day click and 1-day view attribution?
Seven-day click attribution credits purchases associated with an ad click or engagement during the stated attribution period. One-day view attribution credits purchases after a person saw an ad, even without a meaningful interaction. Comparing the two exposes campaigns whose blended results depend heavily on view-through conversions and highlights campaigns producing stronger click-driven purchases.
Q: How does frequency help optimize Facebook ads?
Frequency measures the average number of times each reached person saw an ad, calculated by dividing impressions by reach. It indicates whether spending is repeatedly reaching the same people. The account example showed a retargeting campaign at 6.89 over 30 days and a prospecting campaign at 2.93, reflecting their different objectives.
Q: Should cost per add-to-cart determine Facebook ad success?
Cost per add-to-cart should be treated as a guiding signal, not a final measure of success. The transcript notes that a low cost per add-to-cart corresponds with a low cost per purchase in most cases and gives a $6.88 example. However, advertisers with lower spending should avoid judging success from add-to-carts without sufficient purchase data.
Q: How much should I change Facebook ad budgets at once?
Move approximately 10–20% of the available budget from campaigns with weaker 7-day click performance into campaigns with stronger click performance. Make these adjustments every few days rather than reallocating everything immediately. This incremental process gives results time to balance before the next decision and reduces reliance on a single blended return-on-ad-spend reading.
Q: Why can blended Facebook return on ad spend be misleading?
Blended return on ad spend combines click-driven and view-through results, which can change the apparent ranking of campaigns. A campaign with a high blended return may rely heavily on view conversions, while a campaign with a lower blended return may produce much stronger 7-day click results. Separating attribution can therefore reverse which campaign deserves additional budget.
Summary & Key Takeaways
-
Effective Facebook ad optimization begins with a consistent custom reporting view. The recommended columns cover delivery, attribution, bid strategy, budget, spend, purchases, cost per purchase, purchase value, return on ad spend, link click-through rate, cost per link click, CPM, impressions, reach, frequency, add-to-carts, and cost per add-to-cart.
-
Blended attribution can make campaign performance misleading because Facebook may claim purchases after someone merely viewed an ad shortly before buying. Comparing 7-day click and 1-day view results reveals which campaigns generated stronger interactions, making click-based return on ad spend and cost per purchase more useful for budget decisions.
-
Budget changes should follow the flow of money from the campaign level into ad sets and individual ads. Shift approximately 10–20% away from campaigns with weaker 7-day click performance and toward campaigns with stronger click-based results, then wait a few days and repeat gradually until performance balances across the account.
Read in Other Languages (beta)
Share This Summary 📚
Summarize YouTube Videos and Get Video Transcripts with 1-Click
Try YouTube Summary with ChatGPT & Claude or YouTube Transcript Generator
Explore More Summaries from Sam Piliero 📚




Summarize YouTube Videos and Get Video Transcripts with 1-Click
Try YouTube Summary with ChatGPT & Claude or YouTube Transcript Generator