How to Trade the AM Trend in Index Futures (ICT)
TL;DR
The AM trend, or morning swing, runs from the 9:30 AM equities open to noon New York time, with the true day high or low typically forming between 9:30 and 10:30 AM. Confirm direction using index SMT: compare relative highs and lows across the NASDAQ, Dow, and S&P between 5 AM and 9:30 AM, where one index failing to move with the others signals institutional order flow.
Transcript
okay folks as a reminder we are discussing commodities and it's important that I remind you that this disclaimer is important everything we say here as it relates to this lesson should be viewed as a paper trade idea only okay June 2017 ICT mentorship ICT index Trading lesson two the am trend okay the am trend now obviously when we refer to the am ... Read More
Key Insights
- The AM trend, also called the morning swing, is defined as the price swing between the 9:30 AM equities open and noon New York time, and it can either continue the overnight direction or reverse outright from the open.
- The true day high or low tends to form between 9:30 AM and 10:30 AM New York time, and the AM trend often ends between 10:30 AM and 11 AM but can extend to noon before the New York lunch hour.
- barchart.com displays index futures in Central Time, one hour behind New York, so the 9:30 AM to noon AM session appears as 8:30 AM to 11 AM on those charts.
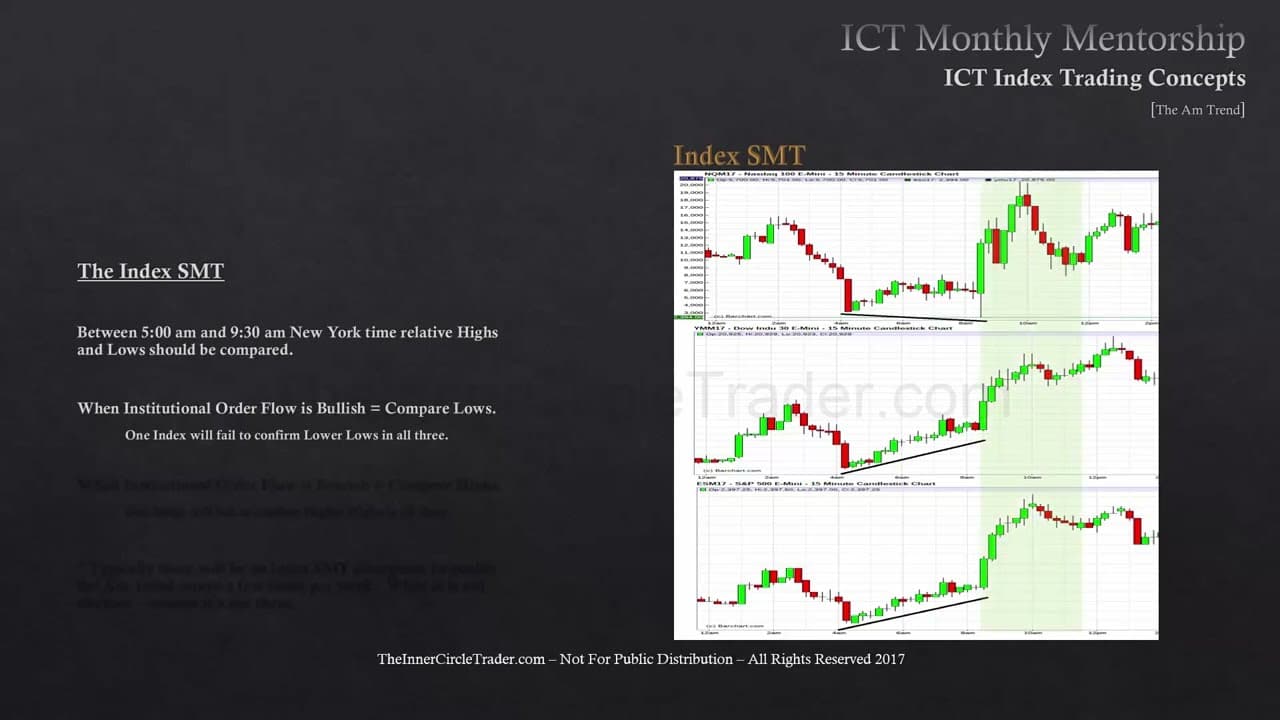
- Index SMT divergence compares relative highs and lows across the NASDAQ, Dow, and S&P e-mini futures between 5 AM and 9:30 AM New York time to confirm the AM trend direction.
- When institutional order flow is bullish, all three indices trade lower but one fails to make a lower low, and that failure to confirm is the bullish confirmation for trading the AM trend.
- When institutional order flow is bearish, traders compare relative highs between 5 AM and 9:30 AM, expecting one index to fail to confirm a higher high while the others move up in tandem.
- The 5 AM start of the SMT window matters because London traders take lunch then and return to pour large flows into the North American indices, building order flow into the New York open.
- AM trend entries are framed using price delivery arrays such as bullish and bearish order blocks, fair value gaps, breakers, and turtle soup stop runs identified from the overnight London session.
Install to Summarize YouTube Videos and Get Transcripts
Explore YouTube Video Summarizer or Get YouTube Transcript Extractor
Questions & Answers
Q: What is the AM trend in index futures trading?
The AM trend, also called the morning swing, is the price swing or trend that typically forms daily between the 9:30 AM equities open and noon New York time. It can be a continuation of the overnight direction or an outright reversal right from the 9:30 AM open. The true day high or low tends to form between 9:30 AM and 10:30 AM, and the trend can end between 10:30 and 11 AM but is anticipated to continue up to noon before the New York lunch hour.
Q: How do you convert the AM session times on barchart.com charts?
barchart.com displays index futures data in Central Time, which is one hour behind New York time. So what appears as 8:30 AM to 11 AM on the bar charts is actually 9:30 AM to noon New York time. The AM trend begins at 9:30 AM New York or 8:30 AM Central, and ends at noon New York or 11 AM Central. Traders need to make this adjustment when studying the morning swing on barchart.com data.
Q: What is index SMT and how is it used to confirm the AM trend?
Index SMT compares relative highs and lows across the three main indices, the NASDAQ, Dow, and S&P e-mini futures, between 5 AM and 9:30 AM New York time. When institutional order flow is bullish, all three should trade lower but one index will fail to confirm a lower low, and that failure is the bullish confirmation. When order flow is bearish, you compare highs and look for one index failing to make a higher high while the others move up in tandem.
Q: Why does the SMT window start at 5 AM New York time?
The 5 AM start matters because London traders take their lunch around that time and then return, though the exact time varies and could be 5:30 or 6 AM. Traders wait for the buildup of orders coming from UK and European traders who still have trading hours left and want to trade the North American indices such as the NASDAQ, Dow, and e-mini futures. These large flows pouring in create the crack in correlation between the indices.
Q: What time does the true daily high or low usually form?
The true day high or low will tend to form between 9:30 AM and 10:30 AM New York time. Between the 9:30 AM open and noon there is typically a trend or price swing, referred to as the AM trend or morning swing. In the transcript examples, highs are shown forming at 10:30 AM New York time. The AM trend can end between 10:30 and 11 AM but is anticipated to potentially continue up to noon for the New York lunch hour.
Q: What is a bullish order block example given in the lesson?
In one example, at the beginning of the New York AM session price trades down into a previous down-closed candle, which is the bullish order block, and then price expands on the upside, with the highs forming at 10:30 AM New York time. In another, price runs into a bullish order block and reprices higher, creating the AM trend from 23.94.50 up to 23.99.50. Another example shows price trading from the 23.52 handle up to almost 2368, trading to the 2367 big figure.
Q: How does the London session set up the New York AM trend?
The overnight London session price action provides reference points and catalysts for the New York AM session. In one Dow e-mini example, price trades all the way down during London and clears out stops at a level, creating a bullish breaker from the last two up-close candles. That breaker becomes the catalyst for institutions to reduce or remove exposure, driving the expansion move at the 9:30 AM equities open. The London run-out on the lows acts as a precursor to the AM expansion.
Q: What example shows bullish accumulation across the three indices?
In the bullish example, the NASDAQ e-mini on a 15-minute chart makes a lower low right at the 9:30 AM equities open, but the Dow creates a higher low and the S&P mini futures also makes a higher low over the same 5 AM to 9:30 AM window. This divergence reveals massive accumulation under the Dow and S&P futures while the tech sector rallied off it. By and large all the indices then moved up, confirming something bullish behind the scenes through the index SMT.
Summary & Key Takeaways
-
The lesson, part of the June 2017 ICT index trading mentorship and presented as a paper trade idea only, defines the AM trend as the daily price swing from the 9:30 AM New York equities open to noon, with the true day high or low usually forming between 9:30 and 10:30 AM.
-
Because barchart.com shows futures in Central Time, one hour behind New York, the AM session appears as 8:30 AM to 11 AM. Examples across the NASDAQ, Dow, and S&P show price running into order blocks and fair value gaps left by the overnight London session before expanding into the trend.
-
Index SMT confirms direction by comparing relative highs and lows across three indices between 5 AM and 9:30 AM New York time. When one index fails to make a lower low while the others do, it reveals bullish accumulation; the reverse, a failed higher high, signals bearish order flow.
Read in Other Languages (beta)
Share This Summary 📚
Summarize YouTube Videos and Get Video Transcripts with 1-Click
Try YouTube Summary with ChatGPT & Claude or YouTube Transcript Generator
Explore More Summaries from The Inner Circle Trader 📚




Summarize YouTube Videos and Get Video Transcripts with 1-Click
Try YouTube Summary with ChatGPT & Claude or YouTube Transcript Generator