How to Trade the Daily Bias in Forex with ICT Concepts
TL;DR
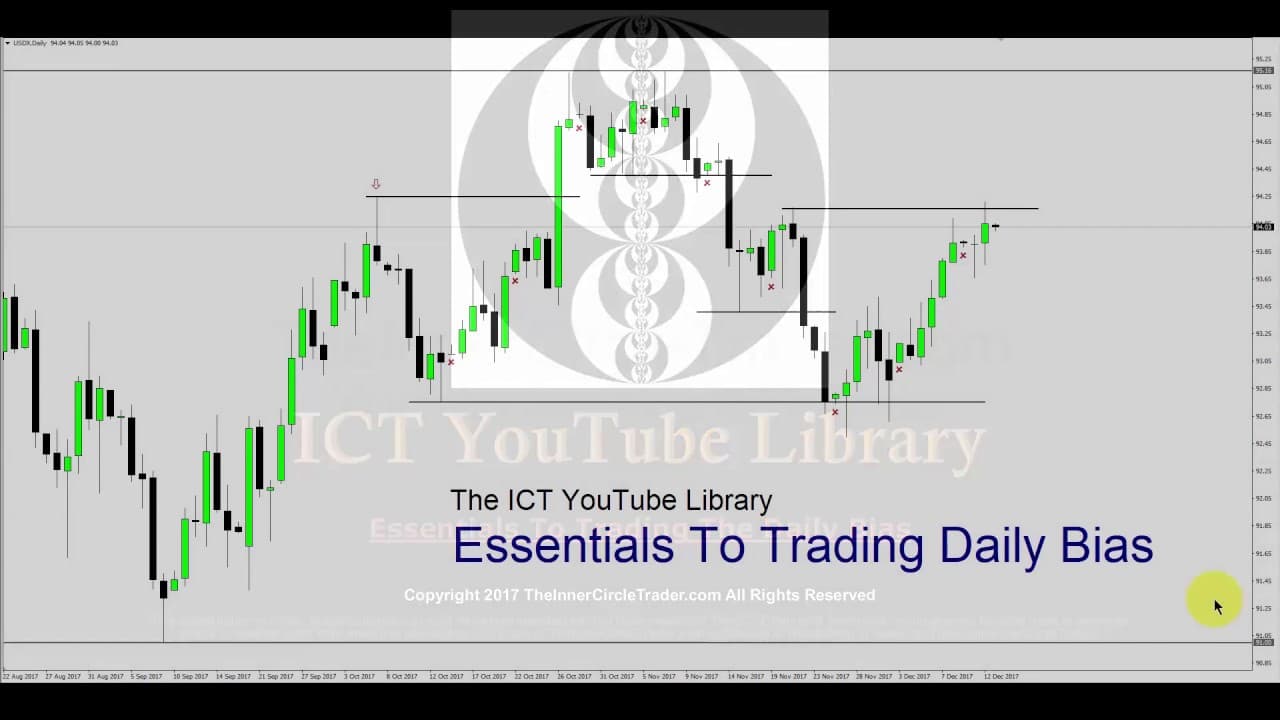
Daily bias is the likelihood that a day closes up or down, judged from how price reacts at intermediate-term swing highs and lows. In a bullish market, expect price to reach for the previous day's high while the previous day's low holds as support; in a bearish market, reverse it. There is no guarantee, so practice in a demo account.
Transcript
okay folks welcome back this teachings gonna mean specifically dealing with essentials to trading the daily bias okay folks we're looking at the dollar index this is a daily chart and I want to cover some essentials and my understanding about how to trade daily bias before we begin just understand that this is not to teach you every single ... Read More
Key Insights
- Daily bias is the effort to ascertain whether a day will be an up-close or a down-close day, not a certainty about tomorrow's direction but an informed opinion built from repeatable observations of price behavior.
- No method guarantees a correct daily bias because both teacher and trader are human and make mistakes, so the framework should be treated as a probability tool rather than a be-all, end-all answer.
- When the market is not trending or moving parabolically, it works off classic support and resistance theory, and the core challenge is deciding which highs, lows, support, and resistance levels to actually use.
- Intermediate-term and short-term swing highs and lows are the key turning points to mark, because they are potential reversal spots where price can fail to follow through after breaking an old high or low.
- A run above an old high can just as easily reject and trade back below it, and a break below an old low can come back above and stay inside the prior range, so breaks must be watched for false moves.
- When price breaks a swing high and finds support that held on repeated tests below, the market is signaling it wants to go higher, so the next reachable resistance level becomes the logical target.
- In a bullish bias the previous day's high is the target and the previous day's low should hold as support with little movement below it; in a bearish bias the setup reverses toward the previous day's low.
- Before expecting price to reach a level, factor in whether the current daily candle has enough range to travel to the intermediate-term high or low above or below it.
Install to Summarize YouTube Videos and Get Transcripts
Explore YouTube Video Summarizer or Get YouTube Transcript Extractor
Questions & Answers
Q: What is daily bias in trading?
Daily bias is the trader's attempt to ascertain the likelihood that a given day will close higher or lower, meaning an up-close or a down-close day. It is not a guaranteed forecast for every session but an informed opinion built by reading how price behaves around key levels. The teacher emphasizes that because humans make mistakes, the bias can be wrong and should never be treated as a be-all, end-all certainty.
Q: How do you find the daily bias across different pairs?
You find bias by looking at the daily chart for intermediate-term and short-term swing highs and swing lows, which act as key turning points and potential reversal areas. You then assess whether price is running above an old high that could reject lower, or below an old low that could reclaim higher. From how price reacts at these points, you judge whether the market wants to reach the previous day's high or the previous day's low, giving a bias that can be applied across pairs even without knowing each day in advance.
Q: Why does the market move between support and resistance when not trending?
When the market is not in a trending model or a parabolic move up or down, it trades off traditional support and resistance theory, moving in an ebb and flow from overbought to oversold to equilibrium and consolidation. Price expands to an overbought or oversold condition, consolidates, then makes a new move. This range-bound behavior is exactly the scenario the dollar was showing, and it is why marking swing points matters so much for reading bias.
Q: How do you choose which support and resistance levels to use?
The main problem with support and resistance theory is deciding which high, low, support, or resistance to rely on. The teacher starts with the most obvious key turning points, the intermediate-term swing highs and lows where price could reverse, rather than every minor short-term level. When a swing high breaks, he looks to the left for the next old intermediate-term high, because that becomes the next form of resistance the market is likely to reach for.
Q: What does a break above an old high tell you about the daily bias?
A break above an old high suggests price could continue higher, but you must stay mindful that it can reverse and trade back below that high as a false break. If, however, price has repeatedly failed to break below a support level and then breaks a swing high, the market is telling you it wants to go higher. In that case the bias turns bullish and you look for the next resistance level and the previous day's high as targets.
Q: How does the previous day's high and low define bias?
When the market is bullish, the previous day's high becomes the target and the previous day's low should act as support, with little to no movement below that low, so the focus stays on the buy side reaching for the prior high. When the market is bearish, the scenario reverses: price should be unable to get above the previous day's high and instead seeks the previous day's low. This gives a clear daily reference for where price is trying to go.
Q: When should you not expect price to reach a targeted level?
Even with a clear bias, you should factor in whether the current daily candle has enough range to reach the intermediate-term level above or below it. If price has already extended, it may lack the room to travel to the next swing high or low that day. The teacher checks each candle's opening and movement, noting when price pierces a prior level but comes right back inside the daily range, showing no significant change in underlying direction yet.
Q: Why should you practice daily bias in a demo account first?
The teacher repeatedly warns that nothing he shares guarantees positive results, since both he and the trader are human and can be wrong. Because of this uncertainty, he recommends practicing these concepts in a demo account, the sandbox, to build understanding of daily bias without risking real capital. Working through the swing points, support and resistance reads, and previous-day targets in a demo lets a trader develop the skill before relying on it live.
Summary & Key Takeaways
-
The lesson covers essentials for trading daily bias on the dollar index daily chart, defining bias as ascertaining the likelihood of an up-close or down-close day. The teacher stresses this is not a guaranteed prediction for every day but a repeatable way to form an opinion across pairs, best practiced first in a demo account.
-
When the market is range-bound rather than trending or parabolic, it obeys classic support and resistance. The difficulty is choosing which levels matter, so the approach starts with obvious intermediate-term swing highs and lows as turning points where price may reverse, fail to follow through after breaking an old high, or reclaim after breaking an old low.
-
Once a swing high breaks and support holds beneath, the bias turns bullish, targeting the next resistance and the previous day's high while the previous day's low acts as support. The teacher walks each following candle forward, checking whether price reaches for the prior high and whether the candle has enough range, reversing the logic for bearish days.
Read in Other Languages (beta)
Share This Summary 📚
Summarize YouTube Videos and Get Video Transcripts with 1-Click
Try YouTube Summary with ChatGPT & Claude or YouTube Transcript Generator
Explore More Summaries from The Inner Circle Trader 📚



Summarize YouTube Videos and Get Video Transcripts with 1-Click
Try YouTube Summary with ChatGPT & Claude or YouTube Transcript Generator