2025 Lecture Series: How Do You Analyze SMC Opening Range Gaps?
TL;DR
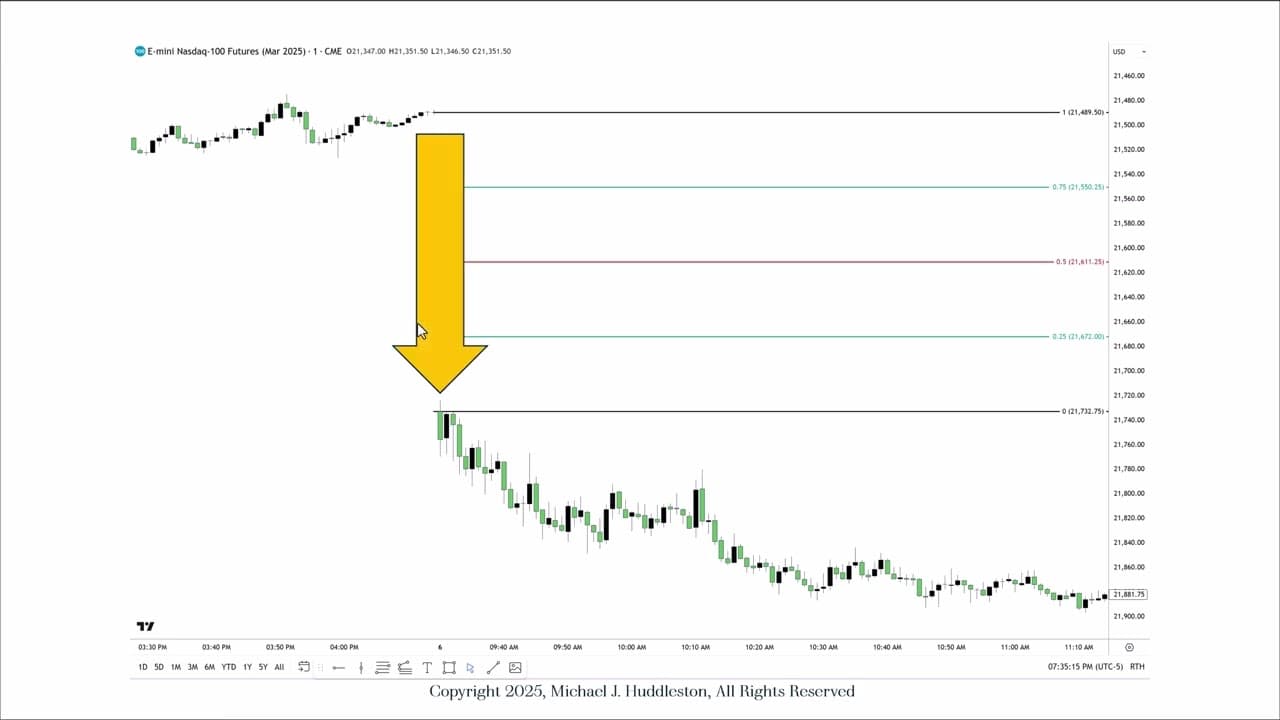
Analyze an SMC opening range gap by comparing the previous regular-trading-hours settlement at 4:14 p.m. with the next trading day’s 9:30 a.m. opening price, using New York time on a one-minute chart. An opening above settlement is a premium gap; an opening below it is a discount gap. The lecture explains Fibonacci placement, the 25% and 50% levels, and why a gap of 120 handles or more may remain unfilled. Read on for the specific rules.
Transcript
folks welcome back all right so we're going to be doing a very specific study on the smart money concept opening range Gap right so obviously I started this lecture series off with some general commentary around it as I stated I would be doing very specific details and rules and things that nature around the model that I'll be employing in 2025 so ... Read More
Key Insights
- An opening range gap is defined by the difference between the previous day's close and the next day's opening during regular trading hours.
- The gap is classified as a premium if it opens higher and a discount if it opens lower than the previous close.
- A premium gap is analyzed by drawing Fibonacci levels from the previous close to the new opening price.
- A discount gap is analyzed by reversing the Fibonacci drawing direction, from the opening to the previous close.
- Gaps larger than 120 handles are less likely to be immediately filled and may continue in the gap's direction.
- Gaps between 20 and 75 handles often see price action returning to the mid-gap level.
- Traders should toggle their charts to regular trading hours to accurately identify and analyze opening range gaps.
- Economic reports and market conditions play a crucial role in determining whether a gap will be filled or continue in its direction.
Install to Summarize YouTube Videos and Get Transcripts
Explore YouTube Video Summarizer or Get YouTube Transcript Extractor
Questions & Answers
Q: How do you identify an SMC opening range gap?
Set the chart to regular trading hours, New York time, and use a one-minute chart. Compare the previous trading day’s 4:14 p.m. settlement price with the next trading day’s opening price at 9:30 a.m.; the difference between those prices defines the opening range gap.
Q: What is the difference between an opening range gap and a new day opening gap?
An opening range gap is defined using regular trading hours, specifically the move from the 4:14 p.m. settlement to the next 9:30 a.m. opening. When electronic trading hours are displayed, the resulting information relates to new day opening gaps or new week opening gaps instead.
Q: What is a premium opening range gap?
A premium opening range gap occurs when the 9:30 a.m. regular-hours opening price is higher than the previous trading day’s 4:14 p.m. settlement. Both times are measured in New York local time.
Q: What is a discount opening range gap?
A discount opening range gap occurs when the market opens lower at 9:30 a.m. than the previous day’s 4:14 p.m. regular-hours settlement. It uses the same regular-trading-hours and New York-time settings as a premium gap.
Q: How is Fibonacci applied to a premium opening range gap?
Anchor the Fibonacci tool at the previous day’s 4:14 p.m. regular-hours settlement price. Drag it upward to the next trading day’s 9:30 a.m. opening price.
Q: What can happen when an opening range gap is 120 handles or larger?
The lecture uses 120 handles as a ballpark threshold for a gap that may continue in its existing direction and remain unfilled initially. In a large premium gap, a move below the opening candle’s low may stop around the upper quadrant, or the 25% level of the gap.
Q: What do the 25% and 50% opening range gap levels indicate?
For a large premium gap, price may trade into the upper quadrant at 25% without returning to the previous settlement. The 50% level is described as the middle of the gap, where price may trade later as it begins to rebalance the liquidity void.
Q: How can an economic report affect an opening range gap?
As the market approaches a scheduled economic report, price may trade higher and appear to pump upward. Later in the same week or on the next day, it may trade back into the opening range gap and potentially reach its 50% level.
Summary & Key Takeaways
-
Opening range gaps occur when the market opens significantly higher or lower than the previous day's close during regular trading hours. These gaps are classified as premium or discount based on whether they open higher or lower, respectively. Traders use Fibonacci tools to analyze these gaps, considering factors like market conditions and economic reports to predict potential price movements.
-
Premium opening range gaps are analyzed by drawing Fibonacci levels from the previous day's close to the new opening price. Discount gaps are analyzed by reversing this direction. Gaps larger than 120 handles often suggest continued movement in the gap's direction, while those between 20 and 75 handles may see price action returning to the mid-gap level.
-
Traders should ensure their charts are set to regular trading hours to accurately identify and analyze opening range gaps. Economic reports and market conditions are crucial in determining whether a gap will be filled or continue in its direction. Understanding these factors can help traders make informed decisions based on gap analysis.
Read in Other Languages (beta)
Share This Summary 📚
Summarize YouTube Videos and Get Video Transcripts with 1-Click
Try YouTube Summary with ChatGPT & Claude or YouTube Transcript Generator
Explore More Summaries from The Inner Circle Trader 📚


Summarize YouTube Videos and Get Video Transcripts with 1-Click
Try YouTube Summary with ChatGPT & Claude or YouTube Transcript Generator