How to Trade Liquidity Sweeps With Inverse FVGs
TL;DR
Combine a higher-time-frame liquidity sweep with a lower-time-frame inverse fair value gap before entering a trade. The demonstrated workflow uses the 1-hour chart for trend and sweep analysis, the 5-minute chart for confirmation, a stop beyond the relevant swing, and risk capped at 2% per trade. Entries can target the gap boundary or its midpoint, depending on the preferred balance between confirmation and reward.
Transcript
Hey traders and welcome back to another episode of Smart Risk. There are tons of strategies floating around online, but how often do you actually see someone put them to the test in a live session? Well, that's exactly what we're doing in this episode. I'm going to back test one of my absolute favorite trading setups right in front of you in real t... Read More
Key Insights
- Multiple-time-frame analysis is central to the strategy because the higher time frame establishes market conditions and liquidity sweeps, while the lower time frame provides the inverse fair value gap confirmation and entry location needed to execute the setup.
- The preferred active-trading combination is the 1-hour chart for liquidity sweeps and the 5-minute chart for entries. The 1-hour chart produces more frequent patterns than the 4-hour chart, although the 4-hour sweep patterns are described as more reliable and higher quality.
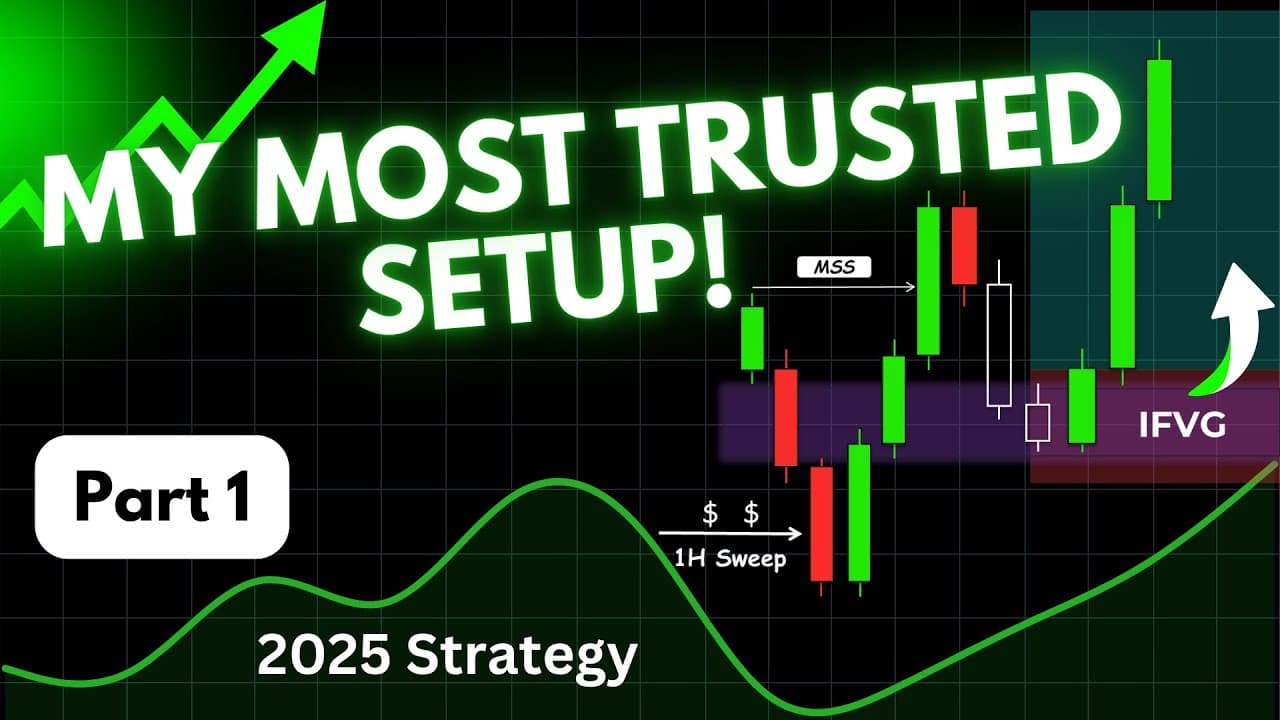
- A bullish liquidity sweep occurs when price trades below sell-side liquidity, such as a demand-zone low, major swing low, or equal lows, and then quickly returns into the prior range. This can precede a move toward buy-side liquidity.
- A bearish liquidity sweep occurs when price trades above buy-side liquidity near recent highs and then immediately returns below their range. The backtest uses this rejection pattern as the higher-time-frame clue before searching for a bearish inverse fair value gap.
- An inverse fair value gap forms when price violates an existing fair value gap and causes that zone to flip its expected role. In the demonstrated bearish setup, a violated bullish fair value gap becomes resistance and provides the area for a short entry.
- A market structure shift is an optional but valuable confirmation because it adds confluence to the liquidity sweep and inverse fair value gap. The transcript identifies a bullish shift when price closes above the most recent swing high, changing the assessed trend to bullish.
- Entry placement can use either the lowest or highest point of the inverse fair value gap, depending on trade direction, or the consequent encroachment at the gap's midpoint. The midpoint is presented as a refined entry that can improve the reward-to-risk ratio.
- Risk management limits exposure to no more than 2% per trade in the backtest. The demonstrated trend-aligned trade targets five times the risk, while trades against the prevailing trend are assigned a more conservative maximum target of three times the risk.
Install to Summarize YouTube Videos and Get Transcripts
Explore YouTube Video Summarizer or Get YouTube Transcript Extractor
Questions & Answers
Q: How do you trade liquidity sweeps with inverse fair value gaps?
Start by determining market direction and locating a valid liquidity sweep on a higher-time-frame chart. Then move to a lower time frame and wait for price to violate a fair value gap, turning it into an inverse fair value gap. Enter when price returns to that zone, place the stop beyond the relevant swing, and target the next liquidity pool while controlling risk.
Q: Which time frames should be used for the liquidity sweep strategy?
The preferred combination for active trading is the 1-hour chart for analyzing market structure and finding liquidity sweeps, followed by the 5-minute chart for inverse fair value gap confirmation and entry. An alternative is to identify sweeps on the 4-hour chart and use the 15-minute chart for confirmation. The 4-hour patterns are described as more reliable, but they occur less frequently.
Q: What is a bullish liquidity sweep in this strategy?
A bullish liquidity sweep happens when price moves below a source of sell-side liquidity, such as the low of a key demand zone, a major swing low, or a cluster of equal lows, and then immediately returns into the prior range. After that liquidity is removed, the strategy anticipates a possible reversal upward toward buy-side liquidity, particularly when the broader market context is bullish.
Q: What is a bearish liquidity sweep in this strategy?
A bearish liquidity sweep occurs when price moves above buy-side liquidity, such as recent swing highs or a group of major highs, and then quickly reverses below their range. That rejection is treated as the first major clue for a possible short trade. The trader then examines the lower time frame for a violated bullish fair value gap that can become resistance.
Q: How does an inverse fair value gap confirm an entry?
An inverse fair value gap appears after price violates an existing fair value gap, causing the zone to change its expected function. A violated bullish fair value gap can become resistance for a bearish trade, while the corresponding opposite setup can provide support. The trader anticipates a return to this flipped zone and uses it as the entry area before price continues toward another liquidity pool.
Q: Where should entry, stop loss, and take profit be placed?
An entry can be placed at the lowest or highest point of the inverse fair value gap, depending on whether the setup is bearish or bullish. A more refined alternative is the consequent encroachment, which is the midpoint of the gap. In the demonstrated short trade, the stop was placed a few pips above the swing high, and the target was set at five times the risk.
Q: How much should be risked on each backtested trade?
The demonstrated backtest risks no more than 2% of the account on any single trade, using an initial account size of $20,000. A trade aligned with the overall trend can target a five-to-one reward-to-risk level. If the setup runs against the trend, the approach becomes more conservative and limits the target to a maximum of three times the amount risked.
Q: How was the first EUR/USD setup identified and tested?
The 1-hour EUR/USD chart showed a bearish overall trend followed by an accumulation phase. Price then swept buy-side liquidity above a recent high and returned below the high's range. On the 5-minute chart, price violated a bullish fair value gap, creating bearish resistance. A sell order was placed at the inverse gap, and price subsequently reached the five-to-one take-profit target.
Summary & Key Takeaways
-
The strategy begins by identifying market direction and a valid liquidity sweep on a higher time frame. A bullish setup requires sell-side liquidity to be swept before price returns above the level, while a bearish setup requires buy-side liquidity to be swept before price falls back below the affected highs.
-
After a sweep, the trader moves to a lower time frame and looks for price to violate a fair value gap. The violated area becomes an inverse fair value gap that may act as new support or resistance. A market structure shift can provide an additional layer of confirmation before entry.
-
The backtest uses EUR/USD, a $20,000 starting account, and risk limited to 2% per trade. In the first demonstrated trade, a bearish higher-time-frame trend, a buy-side sweep, and a bearish inverse fair value gap supported a short position that reached a five-to-one reward-to-risk target.
Read in Other Languages (beta)
Share This Summary 📚
Summarize YouTube Videos and Get Video Transcripts with 1-Click
Try YouTube Summary with ChatGPT & Claude or YouTube Transcript Generator
Explore More Summaries from Smart Risk 📚


Summarize YouTube Videos and Get Video Transcripts with 1-Click
Try YouTube Summary with ChatGPT & Claude or YouTube Transcript Generator