What Every Forex Candlestick Pattern Means for Traders
TL;DR
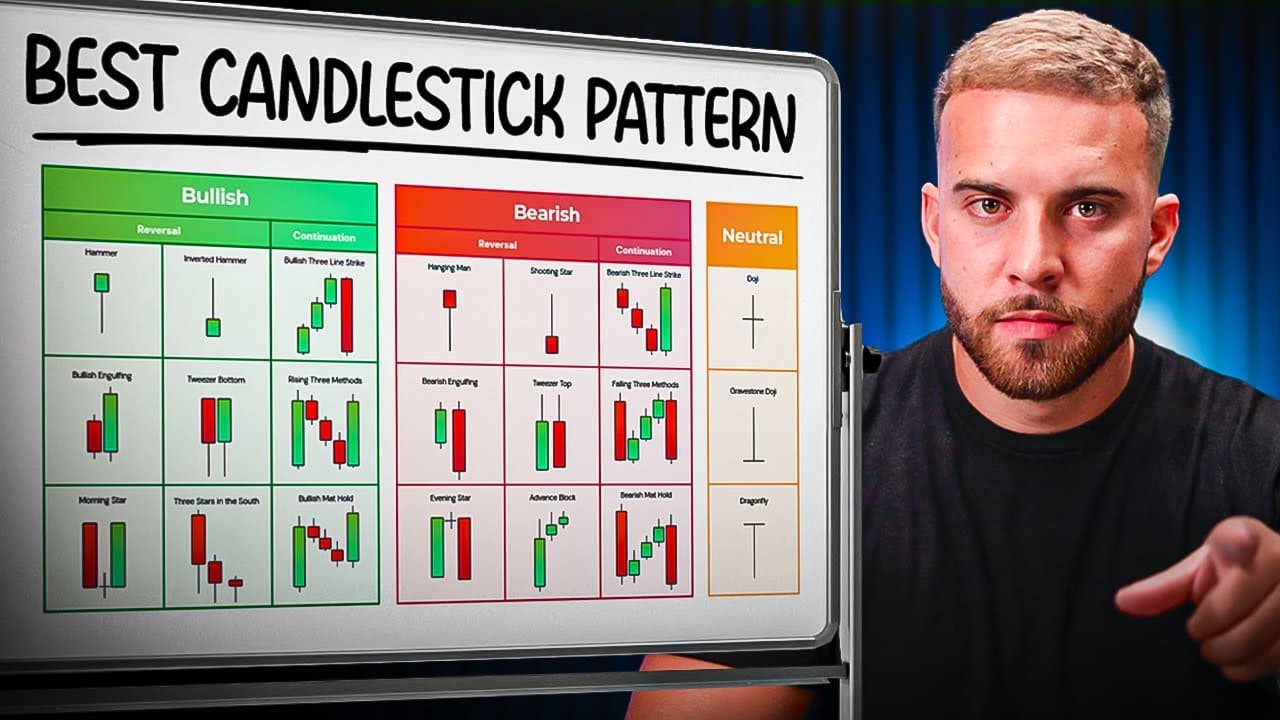
You only need to master about five to ten candlestick patterns to trade profitably, not every pattern that exists. The most valuable ones are the morning star, the evening star, the shooting star, and the head and shoulders, which the trader uses daily. Candlestick size and shape carry meaning: long bodies signal strong momentum, small bodies signal indecision, and long wicks signal rejection.
Transcript
the bullish engulfing the bearish engulfing the hammer the shooting star the evening star the harmoni the flag all of these different types of candlesticks exist now while some of them might not be clear to you that's what this video is exactly about I'm going to review every single one of them to the tea and give them their purpose and why they do... Read More
Key Insights
- Mastering five to ten candlestick patterns is enough to be a profitable trader. The presenter teaches every pattern so viewers can identify them on the charts, but explicitly flags which ones he uses daily and which ones are not needed for profitability.
- Candlestick patterns are more than lines or colors on a chart. They represent actual price movements that repeat time and time again because of what other traders do, which is why a trader can recognize them and capitalize off them.
- The long day is a candlestick with a long body that identifies strong momentum in the market. A big green candlestick means buyers are in the market and a big red candlestick means sellers are in the market, and that day's momentum should continue into the next.
- The short day, with no large body and no large wick, correlates directly with indecision. Also called a choppy market, slow market, or consolidation, it signals the market does not know whether to continue in one direction or reverse, and is planning its next move.
- The belt hold line is a long candlestick that opens at its low or high and closes near the opposite end of the range. It signifies a potential reversal, especially after a significant downtrend or uptrend, and a big wick on it represents rejection.
- The morning star consists of three candlesticks: one red candlestick, one candlestick that stops, and one bullish engulfing candlestick, showing a complete reversal to the upside. The evening star is the same structure reversed, turning the market to the downside.
- The shooting star appears at the end or potential end of an uptrend and consists of a very small body with a large wick. It indicates buyers have no power to push the market higher and that sellers are now stronger than buyers.
- The head and shoulders is the presenter's number one reversal or continuation pattern. It forms three peaks at different levels starting with the left shoulder, and it is not confirmed until price breaks and retests the neckline of the pattern.
Install to Summarize YouTube Videos and Get Transcripts
Explore YouTube Video Summarizer or Get YouTube Transcript Extractor
Questions & Answers
Q: How many candlestick patterns do you need to learn to trade profitably?
About five to ten patterns is all you need to be successful. The video teaches every pattern so you can identify them when they appear on your charts and have the peace of mind of knowing what they are, but the presenter is explicit that you do not need to use every single one. He points out the ones he personally uses every day to be successful and also flags the ones you will not need, teaching those only so you can recognize them rather than trade them.
Q: What is a candlestick pattern and why is it called a candlestick?
Charts can be drawn as a line chart or a bar chart, most commonly known as the candlestick chart. Candlesticks are the red and blue or black and white boxes with lines at the top and the bottom. They are called candlesticks because the little line at the top of the body of the box is where you would light the candle, so the shape resembles an actual candlestick when plotted on a chart. Colors are customizable, and green and red are the most common.
Q: What does a long candlestick body tell you about the market?
A long body identifies a market with a lot of momentum. This is called the long day, and it shows that the day's momentum was very strong and that the next day's momentum should continue in that direction. A big green candlestick indicates that the buyers are in the market, while a big red candlestick indicates that the sellers are in the market. If you are already in a trade it tells you whether to hold, and if you are about to enter it tells you whether to reconsider.
Q: What does a short day candlestick mean in forex trading?
A short day is a candlestick with neither a big body nor a big wick. It is also called a choppy market, a slow market, or consolidation, and it means the market did not move much. This pattern has a direct correlation with indecision: the market does not know whether it wants to continue strongly in one direction or reverse and go the other way. Markets inevitably move fast on some days and slowly on others, and reading that lets you capitalize on it.
Q: What is a belt hold line candlestick?
A belt hold line is a simple long candlestick, green for bullish and red for bearish, that opens at its low or high and closes near the opposite end of its range. It signifies a potential reversal in the current trend, especially when it occurs after a significant downtrend or uptrend. When it carries a big wick, that is also known as a rejection in the market: the candlestick body has effectively melted away and only the wick remains as a trail, showing the move was rejected.
Q: How does the morning star pattern work?
The morning star is made up of three candlesticks: one red candlestick, then one candlestick that stops, then one bullish engulfing candlestick. Together they show a complete reversal, indicating the market is now going to head to the upside. The name is self-explanatory in that the morning is when the day gets started so everything is up. The presenter calls it one of his favorite patterns and says he uses it every single day when he is interested in buying.
Q: What is the difference between a morning star and an evening star?
The evening star is the morning star reversed. Where the morning star signals a reversal to the upside, the evening star signals the market is now going to head to the downside, like the sun going down. It consists of a red candlestick that approaches, followed by a small rejection, then a bearish engulfing candlestick that reverses the market downward. The presenter names both as among the most effective and most powerful entry signals available, used alongside his own strategy, with time frames a big factor.
Q: When should you use the shooting star pattern?
Use it at the end of an uptrend or a potential end of an uptrend. The shooting star has a very small body and a large wick, which indicates the market has no power to continue to the upside and is rejecting that direction. It shows buyers are no longer pushing the market and that sellers are stronger than buyers. The presenter treats it as a top favorite entry signal because when he wants confirmation of a reversal, he wants to see that the buyers are no longer winning and sellers are now in the market.
Summary & Key Takeaways
-
Candlestick charts are built from red and green boxes with lines at the top and bottom, named candlesticks because the wick resembles the line you would light on a real candle. Every box and every line carries information, and the larger the candlestick the bigger the market move it represents.
-
The long day is a candlestick with a long body showing strong momentum that should continue into the next day, while the short day has neither a big body nor a big wick and indicates a choppy, slow, or consolidating market where the market is undecided about its next move.
-
Morning star and evening star are three-candle reversal formations. The morning star runs red candle, a stopping candle, then a bullish engulfing candle to reverse upward. The evening star reverses that sequence to turn the market down. Both are named as the presenter's favorite daily entry signals.
Read in Other Languages (beta)
Share This Summary 📚
Summarize YouTube Videos and Get Video Transcripts with 1-Click
Try YouTube Summary with ChatGPT & Claude or YouTube Transcript Generator
Explore More Summaries from fxalexg 📚




Summarize YouTube Videos and Get Video Transcripts with 1-Click
Try YouTube Summary with ChatGPT & Claude or YouTube Transcript Generator