How to Trade a Bounce Off a Multi-Year Low
TL;DR
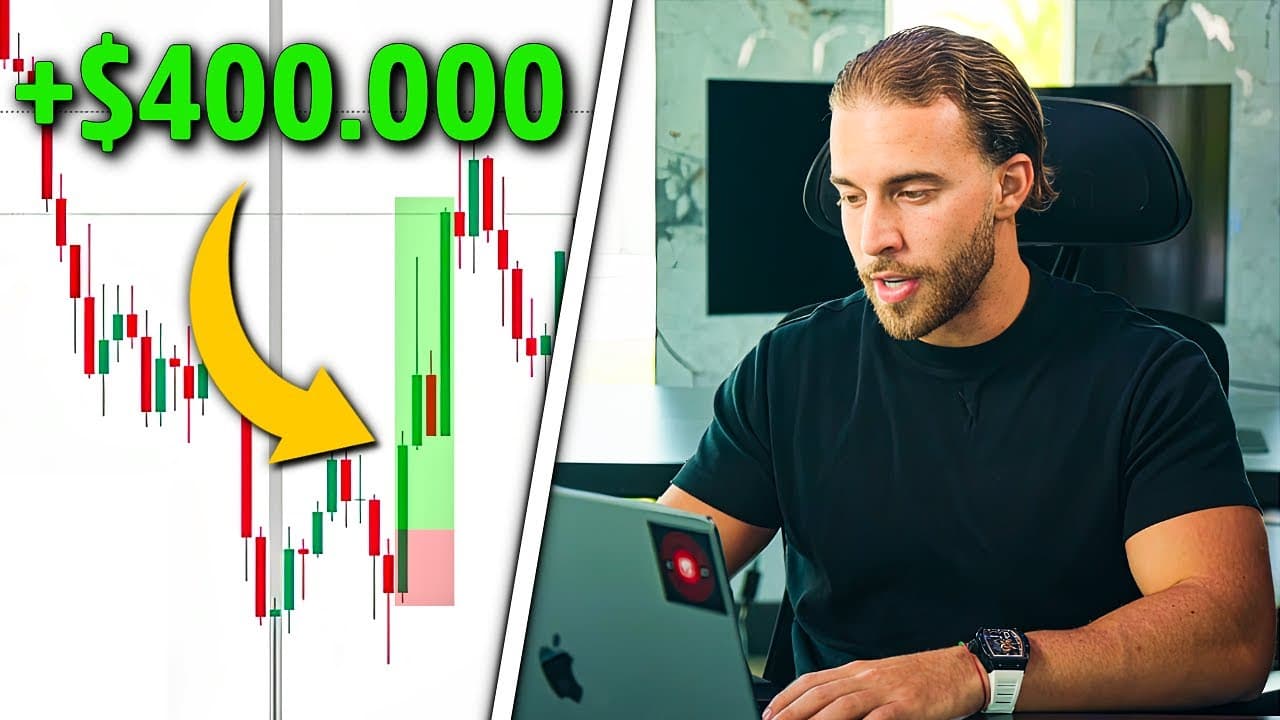
When price reaches a low it has never broken below, selling into that bottom is illogical; look left, count the reactions, and anticipate a bounce instead. On GBPCHF the trader stacked a weekly historical low from September 2022, a daily morning star, a 4-hour break and retest of 1.07182, a bullish 1-hour structure and a 30-minute double bottom, then closed for $415,000.
Transcript
So, let's get right into it. So, GBPCHF, I actually ended up taking the same position two different times. This first position here, I actually ended up getting closed out at break even when price came back. As you guys can see on this screenshot right here, it's the first GBPCHF trades where I basically made $10,000. Yes, $10,000 in profit is my b... Read More
Key Insights
- Selling at a level the market has never broken below is described as illogical, compared to jumping into a pool with no water: from the lowest point price has ever reached, there is no room left to fall, so a retracement upward is the expected outcome.
- Looking left on the weekly time frame is the core of the analysis. Price had hit the September 2022 low repeatedly, and every single touch produced a major reaction to the upside, which is treated as basic pattern repetition rather than prediction.
- This was explicitly a high-risk counter-trend trade, because the weekly, daily and 4-hour trends were all bearish. Counter-trend entries require as many confluences in favor as possible before the strategy is applied.
- The morning star formation appears at multiple levels of the analysis: as a daily reversal pattern with a bullish pin bar, as the continuation pattern that matched the 2022 break and retest of 1.07182, and again as the trigger to re-enter after being stopped at break even.
- The strategy requires at least two time frames in sync before entering. The 1-hour showed a higher low and higher high with a retracement into a well respected 1-hour and 4-hour area of interest, and the 30-minute added a double bottom with a break of the high.
- Break even on this account size still meant $10,000 in profit, because that figure only covers the fees owed on the position. The stop was moved to break even after the trade broke a structure point, letting it run without additional risk.
- Doubling profit does not require more trades or more risk. Holding for a 1 to 4 risk-to-reward instead of the 1 to 2 target would have produced $800,000 to $900,000 on the same position, without adding a single extra dollar of exposure.
- Trades are not held over the weekend unless the position is far in profit and far from the entry point. That rule cost the trade, since holding would have hit the original take profit, but breaking a trading plan and then losing is treated as the only outcome worth regretting.
Install to Summarize YouTube Videos and Get Transcripts
Explore YouTube Video Summarizer or Get YouTube Transcript Extractor
Questions & Answers
Q: How do you trade a bounce off a historical low?
Start on the weekly time frame and look left as far back as possible to see what price has done every previous time it reached that level. On GBPCHF the low from September 2022 had never been broken, and each touch produced a major reaction to the upside. Once the higher time frame justifies a buy, drop down for confirmation: a daily morning star, a 4-hour break and retest of the key level, a bullish 1-hour structure, and a 30-minute double bottom before entering.
Q: Why should you not sell at the lowest point in a market?
Because there is no room left below. The comparison used is jumping into a pool with no water: you are not going anywhere, you just hit the floor. Even when the weekly, daily and 4-hour trends are all bearish and logic says follow the trend, selling at a level price has never broken below is not a logical trade. From the lowest point the market has ever reached, the expectation is a retracement upward before any attempt to break through.
Q: What is a morning star formation used for in this trade?
It served as the reversal and continuation signal at several stages. On the daily time frame a morning star with a bullish pin bar was the first reversal evidence at the historical low. The same pattern had appeared in 2022 after price broke and retested 1.07182, so its reappearance at current price confirmed the repeat. After the first position was stopped at break even, the plan was to re-enter only if another morning star formed, which is exactly what happened.
Q: Why was breaking even still a $10,000 profit?
Because the $10,000 covered the fees owed on the position. On the first GBPCHF trade the stop was moved to break even after price broke above a structure point, and when the market came back it closed the position there. The screenshot shown for that first trade displays $10,000 in profit, which the trader describes as his break even level given the commissions he has to pay on a position of that size.
Q: How many time frames need to align before entering a trade?
At least two time frames must be in sync as part of the strategy. In this setup the 1-hour was bullish, showing a higher low and a higher high, with a retracement into a well respected 1-hour and 4-hour area of interest that acted as clean support from above and clean resistance from below. Confirmation of the reaction from that area, plus the 30-minute double bottom and break of the high, provided the alignment needed to enter.
Q: How can you make more profit without taking more risk?
By letting a valid position run instead of adding trades or increasing position size. The trade was floating between $380,000 and $420,000 in profit with a clean opportunity to reach a 1 to 4 risk-to-reward, worth $800,000 to $900,000, versus the 1 to 2 take profit originally set. That would have doubled the profit by doing nothing at all. Many traders assume more money requires more trades and more risk, which is not entirely the case.
Q: Should you hold a trade over the weekend?
The rule followed here is no, unless the position is very far in profit and very far from the entry point. Because the entry point was still close, the second GBPCHF position was closed on Friday before the market closed at around $415,000. Holding would have paid off, since the original take profit was eventually hit, but sticking to the plan was treated as the correct decision regardless of the outcome.
Q: What is the difference between losing on plan and losing off plan?
Accountability. Missing a profitable trade that did not meet the trading plan is acceptable, and losing while following the plan is also acceptable. What is not acceptable is breaking the trading plan and then losing, because that outcome is entirely the trader's own responsibility. In this case being right about direction and still missing roughly $400,000 twice, once at break even and once by not re-entering, was accepted without emotion.
Summary & Key Takeaways
-
The GBPCHF setup started on the weekly time frame, where price had returned to a low it had never broken below since September 2022. Looking left showed a major upside reaction every single time that low was touched, so the trader anticipated another reaction rather than joining the bearish trend into the bottom.
-
Confluences were stacked downward through the time frames: a morning star formation with a bullish daily pin bar on the daily, a break and retest of the 1.07182 level on the 4-hour that mirrored the 2022 move, a bullish higher low and higher high structure on the 1-hour, and a double bottom on the 30-minute.
-
The first position was closed at break even, which still meant $10,000 in profit because of fees, after the stop was moved to break even on a floating gain of roughly $380,000 to $420,000. The identical trade was re-entered on a second morning star and closed at $415,000 before the weekend.
Read in Other Languages (beta)
Share This Summary 📚
Summarize YouTube Videos and Get Video Transcripts with 1-Click
Try YouTube Summary with ChatGPT & Claude or YouTube Transcript Generator
Explore More Summaries from fxalexg 📚

Summarize YouTube Videos and Get Video Transcripts with 1-Click
Try YouTube Summary with ChatGPT & Claude or YouTube Transcript Generator