How to Forecast Time Series in Python for Beginners
TL;DR
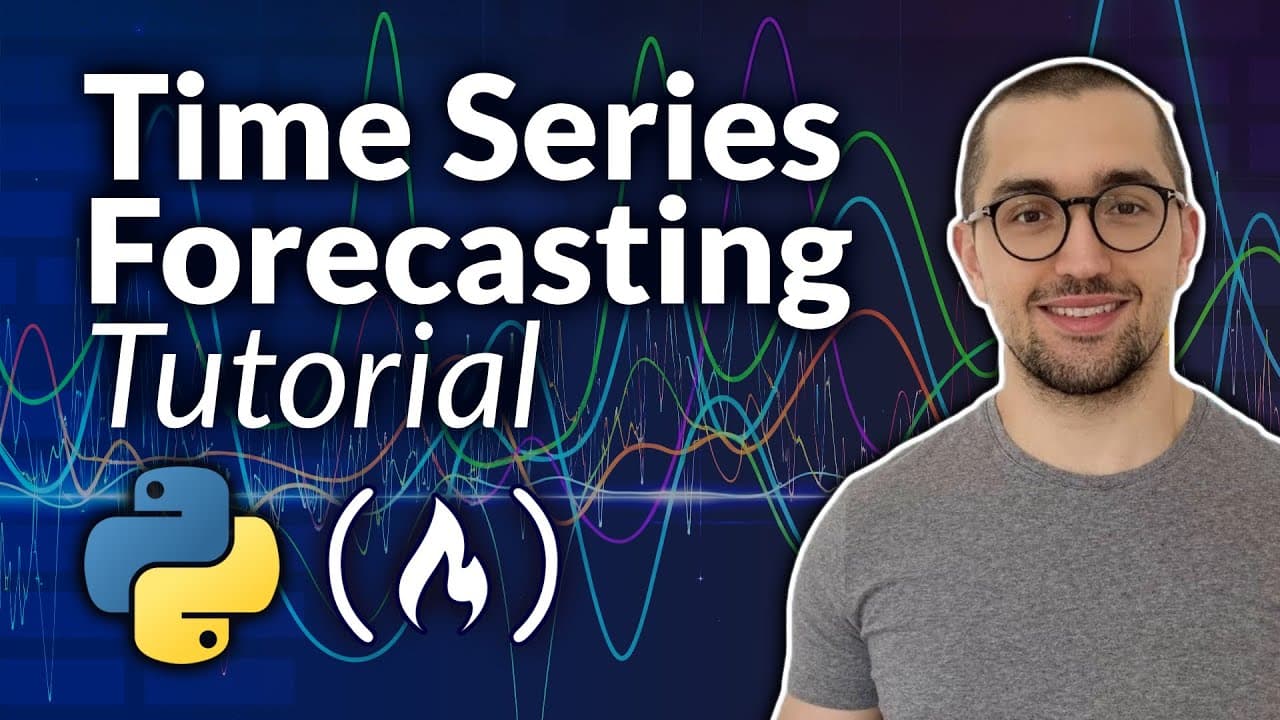
To forecast time series in Python, first identify trend, seasonality, and residuals, then build strong baseline models before trying ARMA or seasonal ARMA. The tutorial demonstrates historical-mean, recent-mean, naive, and seasonal-naive forecasts; for monthly milk production, repeating the previous 12 months almost perfectly matched the actual data. Read on to understand these foundations, evaluation methods, and the practical Python setup.
Transcript
This course is an introduction to time series forecasting with Python. You'll learn what time series data is and how to break it down into its key components like trend, seasonality, and residuals. You'll start by building simple baseline models before learning about powerful forecasting techniques such as ARMA and seasonal ARMA. You'll discover ho... Read More
Key Insights
- A time series is a set of data points ordered in time, ideally equally spaced (every minute, hour, or month). Examples include a stock's closing price, household electricity consumption, or outdoor temperature.
- Most time series decompose into three components: trend (the general direction of the series), seasonality (a pattern repeated at fixed time intervals), and residuals (quick changes not explained by the first two).
- Forecasting works by modeling and predicting trend and seasonality because they are mathematical components. Residuals are assumed completely random, so they cannot be forecast, which is why no forecast is ever perfect.
- Statistical models are the recommended starting point for learning forecasting because they remain relevant today and build the foundational knowledge needed before using advanced machine learning and deep learning techniques.
- A baseline model is a simple model based on a heuristic or statistic, such as the mean of the series, the last known value (naive forecast), or repeating the last season (seasonal naive forecast).
- Using the mean of a recent period beats using the historical mean of the whole series, because old data far in the past is less useful for forecasting when a trend is present.
- The seasonal naive forecast repeats the last full season of data. For monthly milk production data, repeating the last 12 months overlapped almost perfectly with the actual values.
- A strong baseline is critical because it forces your advanced models to genuinely outperform something simple, letting you justify the time spent tweaking, tuning, and selecting more complex models.
Install to Summarize YouTube Videos and Get Transcripts
Explore YouTube Video Summarizer or Get YouTube Transcript Extractor
Questions & Answers
Q: How do beginners forecast time series in Python?
Start by identifying the series’ trend, seasonality, and residuals, then create simple baselines using a mean, the last known value, or the previous season. Compare more advanced approaches such as ARMA and seasonal ARMA against those baselines, using cross-validation and suitable evaluation metrics.
Q: What is a time series in forecasting?
A time series is a set of data points ordered in time and ideally spaced at equal intervals, such as every minute, hour, or month. Examples include stock closing prices, household electricity consumption, outdoor temperature, and monthly milk production.
Q: What are the three main components of a time series?
The three components are trend, seasonality, and residuals. Trend is the series’ general direction, seasonality is a pattern repeated at fixed intervals, and residuals are quick changes not explained by the other two components.
Q: Why can a time series forecast never be perfect?
Forecasting models can project mathematical components such as trend and seasonality. Residuals are assumed to be random and therefore cannot be predicted, so they remain as errors after the model.
Q: What is a baseline forecasting model, and why is it important?
A baseline is a simple model based on a heuristic or statistic, such as the series mean, the last observed value, or the previous season. A strong baseline provides a fair comparison and requires a more advanced model to demonstrate that its additional tuning and complexity produce better results.
Q: How do naive and seasonal-naive forecasts differ?
A naive forecast repeats the last known value throughout the forecast period. A seasonal-naive forecast repeats the most recent complete season; with monthly milk-production data, that meant repeating the previous 12 months, which almost perfectly overlapped the actual values.
Q: Why use a recent-period mean instead of the full historical mean?
Older observations may be less relevant when the series has a trend. In the milk-production example, using the mean of the last year produced some overlap with the actual values, while the full historical mean remained a flat overall average.
Q: What Python setup and libraries does the tutorial use?
The tutorial supports either a local environment with the required dependencies or a Google Colab notebook. Colab already includes basic libraries such as pandas, NumPy, and Matplotlib, so the additional packages identified are StatsForecast and UtilsForecast.
Summary & Key Takeaways
-
The course introduces time series forecasting with Python for people who can code and have done data science but never handled time series data. It covers fundamentals, baseline models, ARMA and seasonal ARMA, cross-validation, exogenous features, prediction intervals, and evaluation metrics, focusing on statistical models coded in Python.
-
A time series is data points ordered and ideally equally spaced in time. Most series decompose into trend (general direction), seasonality (a pattern repeated at fixed intervals), and residuals (random quick changes). Forecasting models the trend and seasonality, while random residuals remain as unavoidable error.
-
Baseline models use simple heuristics: historical mean, recent-period mean, naive forecast (last known value), and seasonal naive (repeat the last season). On milk production data, the recent-period mean and seasonal naive performed best. Good baselines let you fairly judge whether advanced models are truly better.
Read in Other Languages (beta)
Share This Summary 📚
Summarize YouTube Videos and Get Video Transcripts with 1-Click
Try YouTube Summary with ChatGPT & Claude or YouTube Transcript Generator
Explore More Summaries from freeCodeCamp.org 📚
![The Most Important Skills Going Forward with CTO + Homebrew Maintainer Mike McQuaid [Podcast #204] thumbnail](/_next/image?url=https%3A%2F%2Fi.ytimg.com%2Fvi%2F58Tn2xB8kIE%2Fhqdefault.jpg&w=750&q=75)


Summarize YouTube Videos and Get Video Transcripts with 1-Click
Try YouTube Summary with ChatGPT & Claude or YouTube Transcript Generator