How Oil Supply Shocks Could Drive Gold Higher
TL;DR
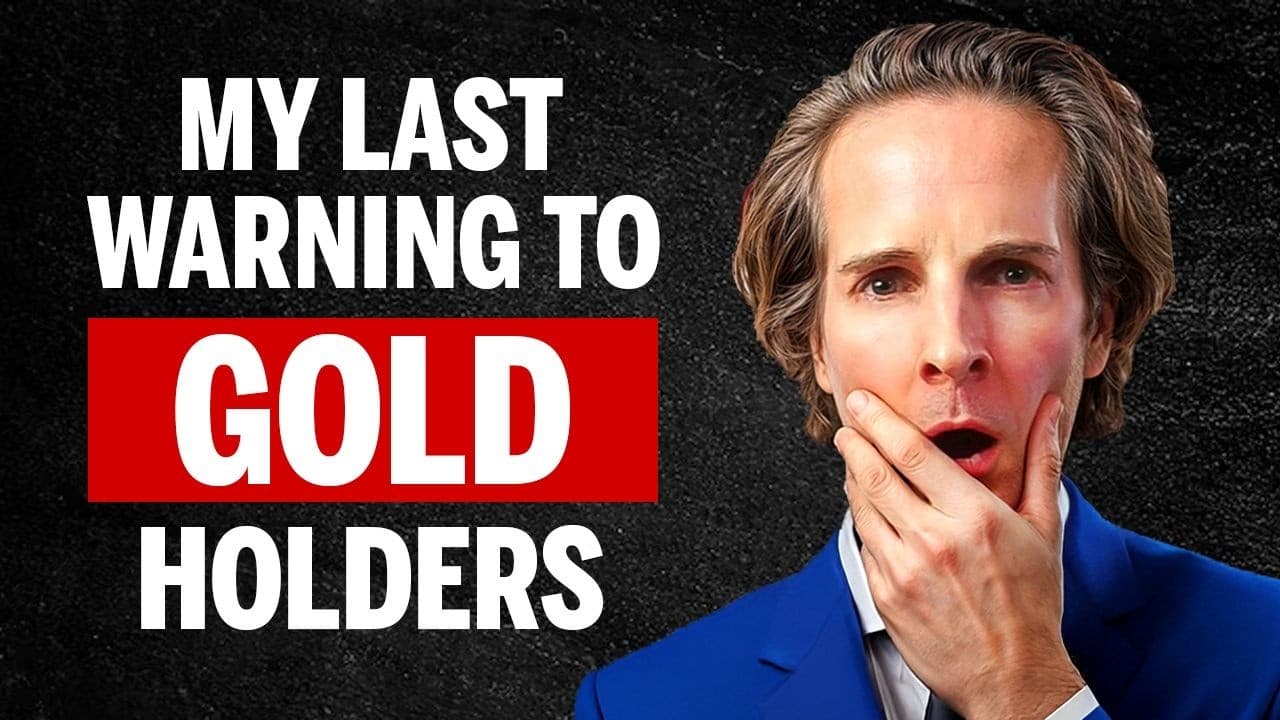
Oil supply shocks have historically coincided with sharp gold gains, and the presenter argues that current gold charts resemble the pattern seen around the 1979 Iran revolution. Rather than relying on headlines or predictions, investors should monitor institutional money flows, ETF activity, trading volume, physical-metal premiums, and predetermined selling rules while recognizing that the analysis is educational, not personalized financial advice.
Transcript
Gold just did something it hasn't done since 1979. And if history repeats, and it always does, what comes next is literally unthinkable. But scroll through social media right now and half the people are telling you gold is going to the moon. The other half are screaming bubble. So, who do we believe? Here's my answer. And Winston's answer. Don't be... Read More
Key Insights
- Charts are presented as a filter for market noise because price, volume, and fund flows may reveal institutional positioning before a geopolitical event becomes widely reported. The presenter argues that headlines describe what already happened, while market activity can indicate how large investors are preparing.
- Gold began breaking out of the presenter's so-called heartbeat pattern in late August 2025, accompanied by a surge in institutional volume. He interprets the pattern as evidence of continuing strength rather than an imminent crash, although this remains his market opinion rather than a guaranteed outcome.
- Gold miners displayed a similar heartbeat formation before beginning their breakout around April of the previous year. The presenter says his group started purchasing miners around that period because it interpreted the chart and money-flow signals as signs of institutional accumulation.
- COMEX is described as a market where banks and institutions trade paper exposure to gold without necessarily owning physical metal. The presenter claims that the gap between paper and physical gold is widening and points to elevated silver stress and declining exchange inventories as supporting signals.
- Oil control is portrayed as a decisive factor in modern conflicts because military equipment and economies depend on fuel. Examples involving Germany, Japan, and the 1973 OPEC embargo are used to argue that lost access to energy can reshape both wars and financial markets.
- Gold rose from $97 to $183 during the 1973 oil embargo, an increase the presenter calculates at 89% in 12 months. He uses this example to support the broader claim that oil supply disruptions can coincide with substantial increases in gold prices.
- Gold rose from $226 to $850 in one year around the 1979 Iran revolution, a gain stated as 276%. The presenter considers the current chart pattern nearly identical to that period, but he frames the comparison as a decision-making reference rather than a direct purchase recommendation.
- Cuba is identified as a possible geopolitical domino because it depends heavily on Venezuelan oil and is experiencing fuel shortages, blackouts, and economic distress. Its location 90 miles from Florida and near Caribbean shipping routes gives it strategic importance in the presenter's analysis.
Install to Summarize YouTube Videos and Get Transcripts
Explore YouTube Video Summarizer or Get YouTube Transcript Extractor
Questions & Answers
Q: How can investors identify institutional gold buying?
Investors can look for changes in gold ETF flows, trading volume, price breakouts, miner performance, physical-metal premiums, and exchange inventory stress. The presenter says large institutions generally buy quietly and consistently rather than announcing their activity publicly. In his framework, unusually strong volume accompanying a chart breakout is more informative than commentary that appears later on television or social media.
Q: Why does the presenter connect oil supply shocks with gold prices?
The presenter argues that oil disruptions create economic uncertainty, inflation concerns, shipping problems, and geopolitical stress, conditions that have repeatedly coincided with gold gains. He cites the 1973 oil embargo, the 1979 Iran revolution, the 1991 Gulf War, and the 2022 Ukraine war. From these examples, he proposes a recurring sequence in which an oil supply shock is followed by stronger gold prices.
Q: What happened to gold during the 1973 oil embargo?
During the 1973 oil embargo, OPEC cut oil supplies by 5% per month, according to the transcript, and oil prices moved from $3 to $5. Over the same general period, gold rose from $97 to $183 in 12 months. The presenter calculates that move as an 89% gain and uses it as historical evidence linking disrupted oil supplies with higher gold prices.
Q: Why is the 1979 gold market relevant to the current outlook?
The 1979 Iran revolution produced an oil supply shock and widespread market anxiety. According to the presenter, gold climbed from $226 to $850 in one year, a 276% increase. He says current gold charts look almost identical to the 1979 pattern. However, he presents the comparison as a framework for assessing risk and opportunity, not as proof that gold must repeat the same performance.
Q: What does COMEX stress mean for precious metals?
COMEX is described as the venue where paper gold is traded by banks and institutions without every position requiring ownership of physical metal. The presenter says stress rises when available metal declines and the difference between paper pricing and physical-market conditions expands. He points specifically to very high silver stress and falling silver holdings as evidence that physical supply deserves close monitoring.
Q: What is the heartbeat pattern in a gold chart?
The heartbeat pattern is the presenter's name for a recurring chart formation that he associates with a major breakout. He says gold displayed this pattern before breaking out in late August 2025, when institutional volume increased sharply. Gold miners reportedly formed a similar pattern before their earlier breakout. The term is part of his analytical framework and is not presented with a formal technical definition.
Q: Why could disruption in the Strait of Hormuz affect gold?
The presenter says 20% of global oil flows through the Strait of Hormuz, making any disruption potentially significant for energy supplies and prices. Iran says the route is blocked, while the United States says it is not. He also cites canceled war coverage for shipping and the risk of tanker attacks. His thesis is that a resulting oil shock could strengthen demand for gold.
Q: Why does the presenter think Cuba could be the next geopolitical flashpoint?
Cuba receives most of its oil from Venezuela through an arrangement involving inexpensive crude, Cuban doctors, and broader support, according to the transcript. Restrictions on Venezuelan oil exports have contributed to Cuban fuel shortages, blackouts, and economic decline. The presenter also emphasizes Cuba's position 90 miles from Florida and near a strategic Caribbean shipping lane used by tankers entering or leaving the Gulf of Mexico.
Summary & Key Takeaways
-
The presenter recommends using charts and money flows to navigate the market's information overload. He says institutional buying can appear in gold ETFs and trading volume before geopolitical developments reach mainstream news, while public commentary from major banks may arrive only after those institutions have already established their positions.
-
Historical examples are used to connect oil disruptions with rising gold prices. The video cites the 1973 oil embargo, the 1979 Iran revolution, the 1991 Gulf War, and the 2022 Ukraine war, arguing that fuel shortages, shipping risks, and geopolitical uncertainty can redirect capital toward gold.
-
The current thesis combines a gold breakout, institutional volume, COMEX stress, Strait of Hormuz disruption risk, and Cuba's fuel crisis. The presenter does not recommend buying gold directly. Instead, he emphasizes understanding historical patterns, watching physical and paper markets, and setting rules for taking profits and limiting losses.
Read in Other Languages (beta)
Share This Summary 📚
Summarize YouTube Videos and Get Video Transcripts with 1-Click
Try YouTube Summary with ChatGPT & Claude or YouTube Transcript Generator
Explore More Summaries from Felix & Friends (Goat Academy) 📚



Summarize YouTube Videos and Get Video Transcripts with 1-Click
Try YouTube Summary with ChatGPT & Claude or YouTube Transcript Generator