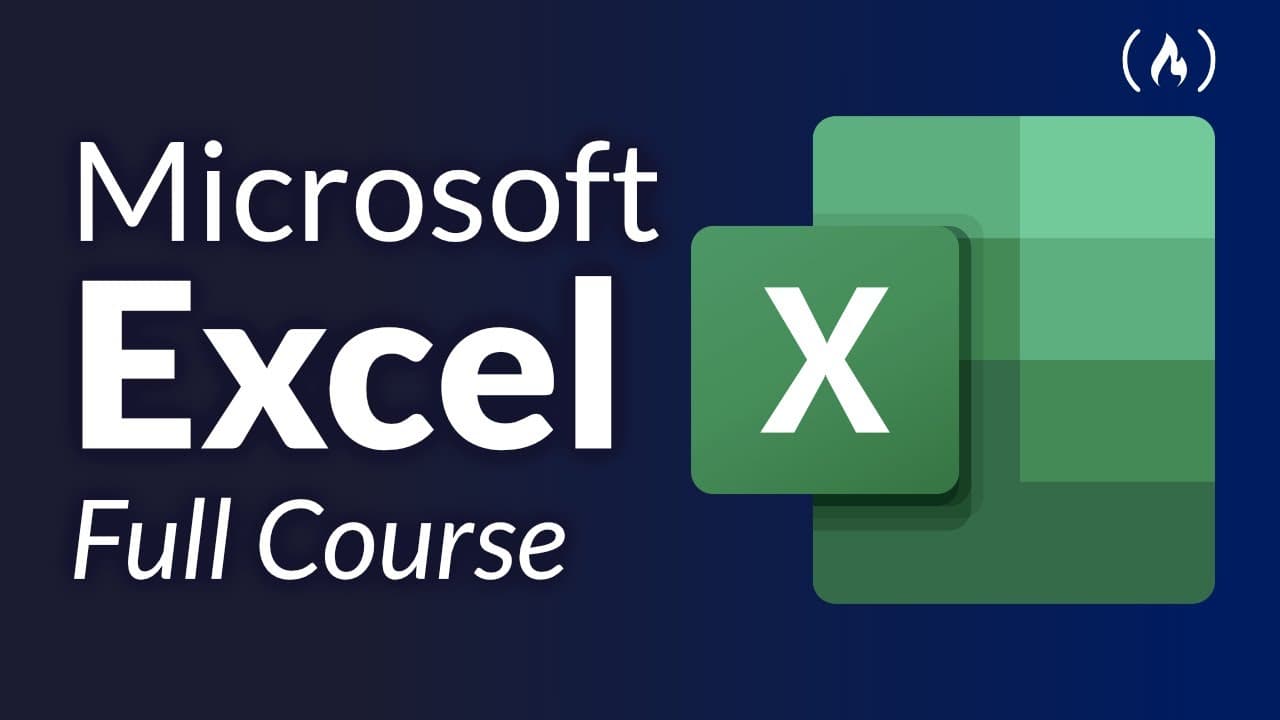
How to Use Microsoft Excel for Beginners: Full Course with Six Practical Projects
TL;DR
Beginners can learn Microsoft Excel by completing six practical projects that progress from guided tutorials to challenge assignments. The course starts with a payroll spreadsheet, then covers a gradebook, career decision tool, sales database, car inventory, and six final problems. Along the way, it teaches formulas, charts, CSV files, VLOOKUP, pivot tables, and text tools. Read on to see how these skills are applied.
Transcript
Hi, and welcome to this course called Excel from the beginning. In this course, we're going to learn how to use Excel using six projects that you can use in real life. So my name is shad Sluiter, and I've been a teacher for computer science and computer applications for several years, what you're about to see are applications that I've used... Read More
Key Insights
- Excel is a powerful tool for organizing and analyzing data through spreadsheets.
- Basic operations include entering data, navigating sheets, and saving files.
- Formulas are essential for calculations, such as computing payroll or grades.
- Charts and graphs visually represent data, aiding in analysis and presentation.
- Relative and absolute references are crucial for accurate formula replication.
- VLOOKUP is used to search for data within a table, enhancing data retrieval.
- Pivot tables summarize large datasets, providing insights and trends.
- Text functions like split and concatenate help manipulate and organize data.
Install to Summarize YouTube Videos and Get Transcripts
Explore YouTube Video Summarizer or Get YouTube Transcript Extractor
Questions & Answers
Q: How can beginners learn to use Microsoft Excel?
Start with a blank workbook and learn how cells, columns, rows, and cell addresses work. This course builds those fundamentals through six practical projects, beginning with payroll and progressing to gradebooks, decision-making, sales analysis, car inventory, and challenge problems.
Q: How do you create a payroll spreadsheet in Excel?
Create columns for employee names, hourly wage, hours worked, and pay. Enter a formula beginning with an equal sign and multiply the wage cell by the hours-worked cell; the example uses C4 times D4 and produces $636 from $15.90 per hour for 40 hours.
Q: How can you apply one Excel formula to multiple employees?
Copy the calculated cell and paste it into the remaining rows, or drag the small dot at the cell’s corner down the column. Excel fills down the formula and calculates the pay for each employee.
Q: What Excel formulas are taught in the course?
The course teaches formulas for payroll, overtime, sales commissions, averages, maximums, and minimums. In the payroll project, predefined functions such as MAX, MIN, and AVERAGE are applied to a selected range of cells.
Q: What is VLOOKUP used for in Excel?
VLOOKUP is presented as a powerful tool for searching through data to find the right item for a choice. The course compares it to searching through a menu for the item you need.
Q: What is a pivot table used for in Excel?
Pivot tables create summary reports from large amounts of data. They condense that data into a more readable form that can support decisions.
Q: What charts and data tools does the Excel course cover?
The course covers pie charts, line charts, and scatter charts, along with sorting sales data and identifying top salespeople and commissions. It also teaches importing and exporting CSV data, relative and absolute references, and splitting or concatenating text.
Q: Which practical projects are included in the Microsoft Excel full course?
The course includes payroll, a gradebook, a career decision tool, a sales database, and a car inventory project. Its final section contains six challenge problems in which learners receive part of a solution and complete the rest using skills from the earlier tutorials.
Summary & Key Takeaways
-
This course provides a comprehensive introduction to Microsoft Excel, focusing on practical applications through six real-world projects. You'll learn essential skills such as data entry, formula creation, and chart making. (50 words)
-
Advanced features covered include VLOOKUP, pivot tables, and text manipulation, which are crucial for managing and analyzing large datasets. The course is designed to be accessible for beginners and useful for those looking to expand their Excel capabilities. (50 words)
-
By the end of the course, learners will be able to create functional spreadsheets for payroll, gradebook management, decision-making, sales analysis, and more, making Excel a versatile tool for personal and professional use. (50 words)
Read in Other Languages (beta)
Share This Summary 📚
Summarize YouTube Videos and Get Video Transcripts with 1-Click
Try YouTube Summary with ChatGPT & Claude or YouTube Transcript Generator
Explore More Summaries from freeCodeCamp.org 📚




Summarize YouTube Videos and Get Video Transcripts with 1-Click
Try YouTube Summary with ChatGPT & Claude or YouTube Transcript Generator