What Is the ICT Opening Range Gap and How to Use It
TL;DR
The opening range gap is the difference between Friday's regular-hours close and the next trading day's 9:30 AM open. A lower open creates a discount gap, a higher open a premium gap, and the midpoint (consequent encroachment) becomes a key reference. Combined with fair value gaps and the New York midnight opening price, it pinpoints where price is likely to reprice.
Transcript
thank you all right folks welcome back I'm gonna try to get through this pretty quickly uh we're presently having a thunderstorm in a don't have this running too much during that in case we have a search so I'm going to counsel you to go and look at last Friday which is June 23rd 2023's market review and the things that I'm going to talk about here... Read More
Key Insights
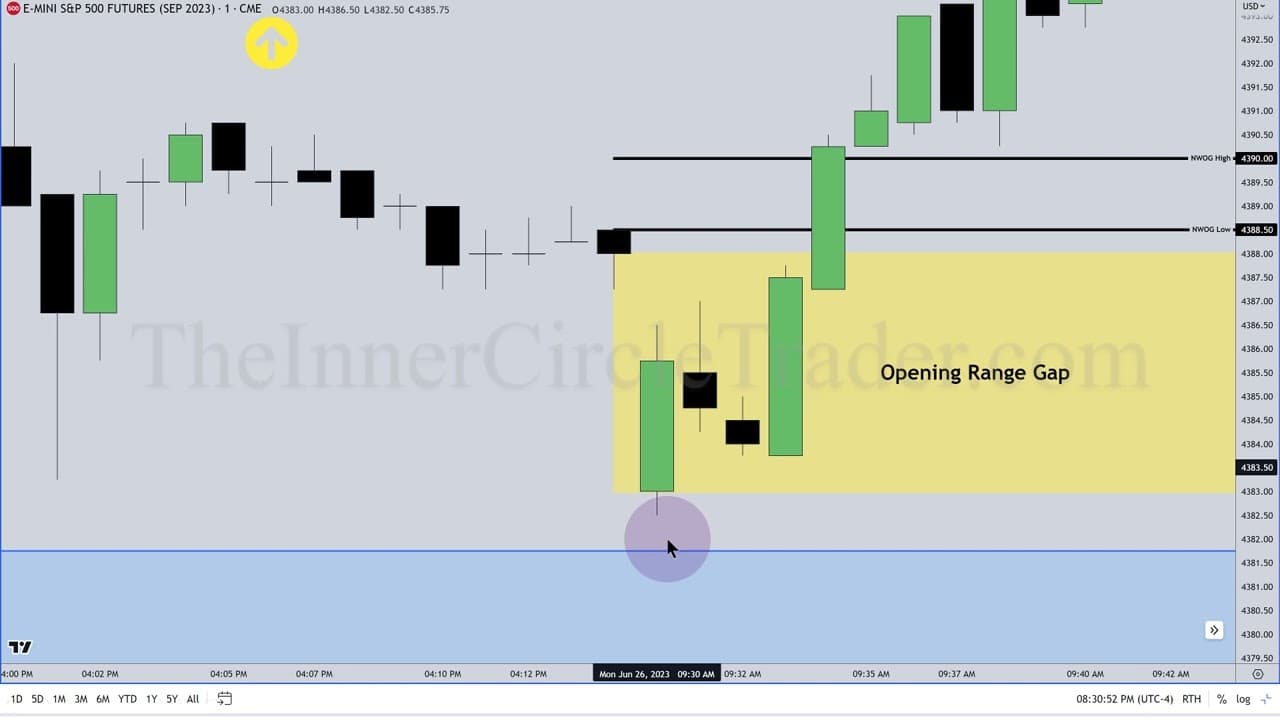
- The opening range gap is defined as the difference between Friday's regular-trading-hours closing price (shown at 4:14 PM) and the next trading day's 9:30 AM opening price. In this example Friday June 23 2023 closed at 4388 even.
- An opening range gap lower means the market opens below Friday's close, creating a discount opening range gap; opening above Friday's close creates a premium opening range gap. This framing tells you whether price opens cheap or expensive.
- Consequent encroachment is the midpoint of any gap or wick, while mean threshold is the 50 percent midpoint of an order block. Both midpoints act as consequential reference levels the algorithm tends to respect.
- A Judas swing is a false run that lures traders to chase, getting them offside before price reverses to a specific PD array level. The 9:30 to 10:00 opening range rally acted as the Judas swing in this session.
- The New York midnight opening price is this candle's opening price extended across the day to 11 AM, and the highest-probability short entries form at price above that midnight opening price rather than at a specific time.
- A SIBI (sell side imbalance buy side inefficiency) is an exposed area of inefficiency that the market wants to reprice back up into with buy-side delivery, with buy stops resting just above it as a draw on liquidity.
- Price was forecast before it happened: a tweet at 9:00 AM New York time on Friday June 23 2023 called the lower of two ES fair value gaps and targeted roughly 4369 to 4370, and the market traded down into it.
- Liquidity targets are chosen deliberately, using buy-side liquidity above old highs (London session highs) and sell-side liquidity below London session lows, so entries aim at counterparty liquidity rather than random price levels.
Install to Summarize YouTube Videos and Get Transcripts
Explore YouTube Video Summarizer or Get YouTube Transcript Extractor
Questions & Answers
Q: What is the opening range gap in ICT trading?
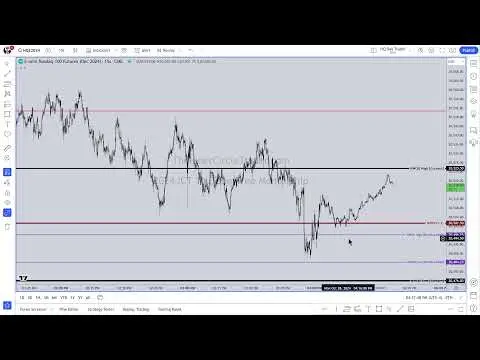
The opening range gap is the difference between Friday's regular-trading-hours closing price and the next trading day's 9:30 AM opening price. In the example, Friday June 23 2023 closed at 4388 even (shown on the last candle at 4:14 PM), and Monday June 26 2023 opened at 9:30 AM. You must toggle regular trading hours, not electronic trading hours, on TradingView to see it correctly, then measure the gap between those two prices.
Q: What is the difference between a discount and premium opening range gap?
An opening range gap lower occurs when the market opens below Friday's close, which is a discount opening range gap. An opening range gap higher occurs when the market opens above Friday's close, which is a premium opening range gap. The distinction tells you whether price is opening cheap (discount) or expensive (premium) relative to Friday's closing price, which informs directional bias and where high-probability entries may form.
Q: What is a Judas swing and how does it work?
A Judas swing is what ICT dubs a false run that gets people to chase it so they get offside. In this session, the market opened at 9:30, rallied up, and sucked everybody in thinking it would go higher, running buy-side liquidity above the London session. Instead the rally was designed for smart money to go short, and price then repriced down to the specific level forecast the previous Friday around 4370.
Q: What is consequent encroachment versus mean threshold?
Consequent encroachment is the midpoint of a gap or a wick, meaning the middle of that range. Mean threshold is the midpoint of an order block, whether a breaker block, bullish or bearish order block, or propulsion block, and it sits at 50 percent of that range. Both are midpoint reference levels, but the terminology differs by structure type: gaps and wicks use consequent encroachment, while order blocks use mean threshold.
Q: What is the New York midnight opening price and why does it matter?
The New York midnight opening price is the opening price of the midnight candle, extended across the trading day all the way to 11 AM. It matters because the highest-probability short entries, when bearish, form at price above the New York midnight opening price. It is a price-based reference rather than a time-based one, so ICT emphasizes entering at that price level rather than at a specific clock time.
Q: What is a SIBI and how does the market treat it?
SIBI stands for sell side imbalance buy side inefficiency, an exposed area of inefficiency where the market did not fully reprice on buy-side delivery. Because it was inefficient with buy-side delivery, the market wants to draw back up into it, meaning upward motion, with buy-side liquidity or buy stops resting just above it. The market ran up initially to attempt to completely reprice to the SIBI high before reversing.
Q: How did ICT forecast the ES target before it happened?
In a tweet at 9:00 AM New York local time on Friday June 23 2023, ICT stated a preference for the lower of two fair value gaps on ES. The market review that day showed a target of roughly 4369 to 4370. ICT notes he does not delete or edit tweets, so the call stands as originally posted, and the market subsequently traded down into that level perfectly on the hourly chart.
Q: Why does ICT choose specific highs for buy-side liquidity instead of any candle?
ICT picks specific highs based on his prior lecture on finding setups in perpetuity, which teaches how to identify liquidity rather than a specific entry pattern. He targets particular liquidity pools such as buy-side liquidity above London session highs and sell-side liquidity below London session lows. Entries aim at that counterparty liquidity, so the chosen high is the one the algorithm is drawing toward, not an arbitrary candle.
Summary & Key Takeaways
-
The presentation focuses on ES and references the Friday June 23 2023 market review, where a weekly fair value gap (a sell side imbalance buy side inefficiency) was identified. A tweet at 9:00 AM New York time preferred the lower of two fair value gaps, targeting roughly 4369 to 4370.
-
The market opened, created a new week opening gap, then rallied through it in a Judas swing that ran buy-side liquidity above the London session and pushed above the New York midnight opening price. This lured retail buyers offside before repricing down to the forecast level near 4370.
-
The opening range gap is measured from Friday's regular-hours close of 4388 even to Monday June 26 2023's 9:30 AM open. A lower open is a discount gap, a higher open a premium gap, and its midpoint is consequent encroachment, used alongside fair value gaps to locate reprice targets.
Read in Other Languages (beta)
Share This Summary 📚
Summarize YouTube Videos and Get Video Transcripts with 1-Click
Try YouTube Summary with ChatGPT & Claude or YouTube Transcript Generator
Explore More Summaries from The Inner Circle Trader 📚
Summarize YouTube Videos and Get Video Transcripts with 1-Click
Try YouTube Summary with ChatGPT & Claude or YouTube Transcript Generator