How to Read Institutional Order Flow | ICT Mentorship Core Content, Month 03
TL;DR
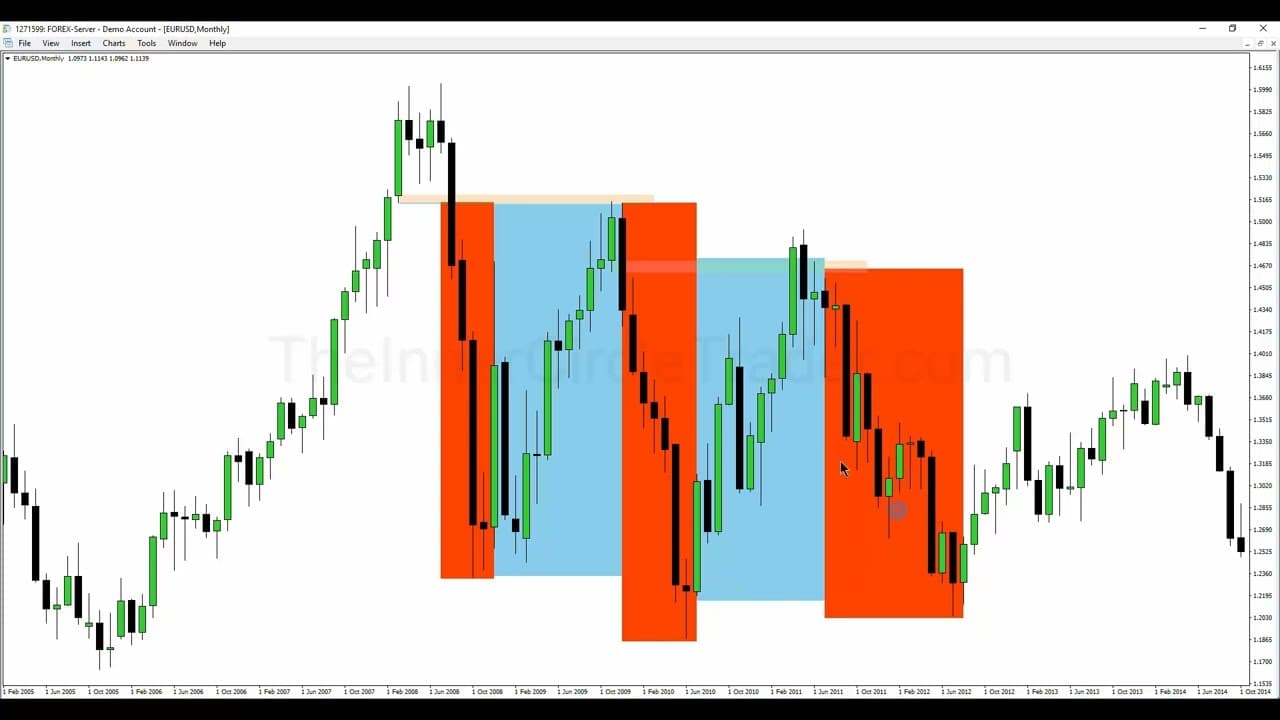
Institutional order flow is read by locating the largest liquidity pools and anticipating which one price will seek next. In lesson two of the ICT Mentorship’s third month, the monthly EUR/USD example shows how candle bodies, sell stops below lows, order blocks, and liquidity voids frame that analysis. Read on to understand the step-by-step reasoning behind the expected price movements.
Transcript
okay folks welcome back this is lesson two of november or the third month of the ict mentorship okay we're going to talk about institutional order flow and what makes it easy to see and we're going to be building a little bit on what we just mentioned in the previous lesson and we'll be using that euro dollar example and here's that order block we ... Read More
Key Insights
- Institutional order flow is about identifying large liquidity pools.
- Monthly and weekly charts reveal where large funds influence the market.
- Retail traders often misinterpret wicks, which represent retail stops.
- Bodies of candles are more significant for institutional volume analysis.
- Market efficiency paradigm involves thinking like a market maker.
- Order blocks indicate areas where the market will likely seek liquidity.
- Institutional moves often precede major price shifts on daily charts.
- Liquidity voids are filled as markets rebalance price levels.
Install to Summarize YouTube Videos and Get Transcripts
Explore YouTube Video Summarizer or Get YouTube Transcript Extractor
Questions & Answers
Q: How do you understand institutional order flow?
Identify the maximum liquidity relative to where price previously traded and where it is now. Then anticipate which liquidity pool price is most likely to seek next, while analyzing candle bodies, closed ranges, and liquidity voids on the monthly chart.
Q: Why does ICT focus on candle bodies instead of wicks?
The lesson treats candle bodies as the area containing institutional volume and closer interbank pricing. Wicks are associated with retail pricing and retail stops, so the analysis allows them to represent erroneous or extreme price delivery.
Q: How are liquidity pools identified below market lows?
When several candle bodies merge around the same general area, the lesson anticipates a large pocket of liquidity below the nearby lows. That liquidity takes the form of sell stops that the market may run before moving toward another liquidity area.
Q: What happens after price clears a pool of sell stops?
In the example, price clears the stops below the lows and returns to a bullish order block, described as the down candle before the upward move. With the lower liquidity absorbed, the market then seeks liquidity on the upside.
Q: What is a liquidity void in this ICT lesson?
A liquidity void is created when price moves quickly away through a sequence of candles, leaving a range that has not been balanced by movement in the opposite direction. The lesson looks for price to return and close that range, such as buying back through an area previously delivered on the sell side.
Q: How do order blocks fit into institutional order-flow analysis?
The lesson uses order blocks as areas to which price can return after running liquidity. Its example identifies a bullish order block as the down candle immediately before an upward move, although the main focus remains on how price seeks the next liquidity pool.
Q: What does it mean to think like a market maker in this framework?
It means asking where the maximum liquidity is in relation to the market’s previous and present locations. The analysis then considers whether price has already rebalanced a void or absorbed stops before identifying the next likely liquidity target.
Q: Why does the lesson begin with a monthly chart?
The monthly chart is used to define sensitive areas, merged candle bodies, liquidity below lows, and ranges that price may rebalance. Once the likely destination is identified on that chart, the trader can step back and frame the market around where price will most likely reach.
Summary & Key Takeaways
-
Institutional order flow focuses on identifying where large liquidity pools exist, often found on monthly and weekly charts. This allows traders to anticipate market movements driven by large funds. By understanding these dynamics, traders can align their strategies with institutional flows rather than retail perspectives.
-
The bodies of candles on charts are crucial for understanding institutional volume, as they represent true market activity. Wicks, in contrast, often reflect retail stops. By focusing on these areas, traders can better predict where the market will seek liquidity next.
-
Order blocks and liquidity voids are key concepts in institutional order flow. These areas indicate where the market will likely move to balance price levels. Understanding these concepts helps traders anticipate significant price shifts and align with institutional strategies.
Read in Other Languages (beta)
Share This Summary 📚
Summarize YouTube Videos and Get Video Transcripts with 1-Click
Try YouTube Summary with ChatGPT & Claude or YouTube Transcript Generator
Explore More Summaries from The Inner Circle Trader 📚



Summarize YouTube Videos and Get Video Transcripts with 1-Click
Try YouTube Summary with ChatGPT & Claude or YouTube Transcript Generator