How to compute variance of a random variable?
TL;DR
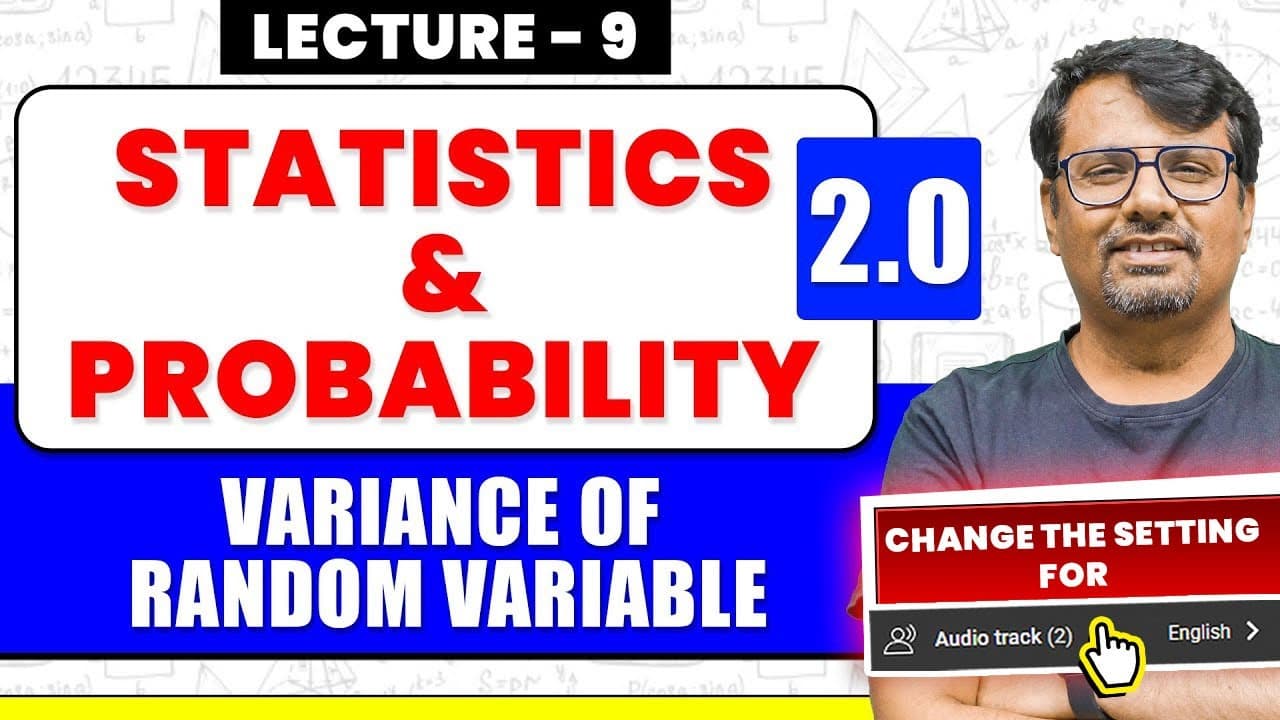
Variance measures how far data spread around the mean. It is the expected value of the squared deviation from the mean, written as E[(X minus mean) squared]. For a discrete variable use summation x squared times p(x) minus (E[X]) squared, and for continuous variables use the corresponding integral forms. This video explains the concepts and formula, and shows the difference between discrete and continuous cases.
Transcript
Hello students, I am Dr. Gajendra Purohit and you are watching our YouTube channel. If you are pursuing B.Sc. B.tech or preparing for any competitive exam where higher mathematics is asked, then our channel will be very helpful for you. Today I am going to tell you about the variance of a random variable. So, in this continuous random variable and ... Read More
Key Insights
- Variance measures how much data deviates from the mean.
- For discrete variables, variance uses summation with probabilities.
- For continuous variables, variance uses integration.
- Variance is the expectation of the squared deviation from the mean.
- The mean is calculated as the sum of values divided by n.
- Variance can be computed as E[X^2] minus (E[X])^2.
- Standard deviation is the square root of the variance.
- If all values are the same, the variance is zero.
Install to Summarize YouTube Videos and Get Transcripts
Explore YouTube Video Summarizer or Get YouTube Transcript Extractor
Questions & Answers
Q: What is variance in simple terms?
Variance is a measure of how much the data values spread out around the mean, showing how far numbers typically lie from the average. It is described in the video as the extent to which data deviates from the standard value, with a zero variance occurring when all data points are identical. The idea is rooted in comparing each value to the average and squaring the deviations to obtain a stable measure of spread.
Q: How is the mean calculated in the example?
In the example, the mean is calculated by summing all the values for the class scores and dividing by the number of students. The specific process shown is summing values such as 2, 6, 5, 4, 10, 8, 9, 7, 3, 1 to get 55, then dividing by 10 gives a mean of 5.5. This mean serves as the reference point for variance.
Q: What is E[X] in the context of variance?
E[X] represents the expected value or the mean of the random variable X. It is computed as the sum over all values of x times their probability p(x) for discrete variables, or the integral for continuous variables. The video explains that E[X] is the fixed mean value around which deviations are measured when calculating variance.
Q: What is E[X^2] and why is it needed?
E[X^2] is the expected value of the square of the random variable, calculated as the sum of x^2 times p(x) for discrete variables, or the corresponding integral for continuous variables. It is needed to compute variance because Var(X) = E[X^2] minus (E[X])^2, capturing the average of squared deviations from the mean and enabling a compact formula.
Q: How does the video derive the variance formula?
The video derives the variance formula by expanding the expression (X minus the mean) squared and applying the expectation operator. This yields E[X^2] minus two times E[X] times the mean plus the square of the mean, which simplifies to E[X^2] minus (E[X])^2 since E[X] equals the mean. This shows Var(X) = E[X^2] minus (E[X])^2.
Q: How is variance different for discrete and continuous variables?
For discrete variables, variance is computed using a summation over all possible values with their probabilities, Var(X) = E[X^2] minus (E[X])^2, where E[X] and E[X^2] are sums of x p(x) and x^2 p(x) respectively. For continuous variables, the same formula holds but the sums are replaced by integrals over the probability density function, Var(X) = E[X^2] minus (E[X])^2, using appropriate integrals.
Q: What happens to variance when all data is the same?
When all data values are identical, the variance is zero. Since every value equals the mean, the deviations (X minus mean) are all zero, and squaring these zero deviations yields zero for every term in the variance sum or integral. The video uses this to illustrate variance as a measure of spread, which disappears with constant data.
Q: Why is standard deviation mentioned after variance?
Standard deviation is mentioned because it is the square root of the variance, providing a measure of spread in the same units as the data. While variance quantifies the average squared deviation, standard deviation translates that dispersion back into the original units, making it easier to interpret. The video indicates standard deviation as the square root of the variance and connects it to the concept of deviation from the mean.
Summary & Key Takeaways
-
Variance shows how much data deviates from the mean, with zero variance when all values are identical. The video explains the mean as the average value and demonstrates the idea using a class of numbers to illustrate deviations. It also derives the variance formula by expanding (X minus E[X]) squared.
-
The video covers both discrete and continuous random variables, noting that the same variance concept applies but the computation differs: summation for discrete and integrals for continuous. It emphasizes that E[X] is the mean and E[X^2] is needed to compute variance via E[X^2] minus E[X]^2.
-
The speaker connects variance to standard deviation later and references moments, expectations, and how to compute E[X] and E[X^2], providing guidance on interpreting results for statistical problems and exams like GATE and CSIR NET.
Read in Other Languages (beta)
Share This Summary 📚
Summarize YouTube Videos and Get Video Transcripts with 1-Click
Try YouTube Summary with ChatGPT & Claude or YouTube Transcript Generator
Explore More Summaries from Dr.Gajendra Purohit 📚



Summarize YouTube Videos and Get Video Transcripts with 1-Click
Try YouTube Summary with ChatGPT & Claude or YouTube Transcript Generator