How to Calculate Systolic, Diastolic, and MAP from Traces
TL;DR
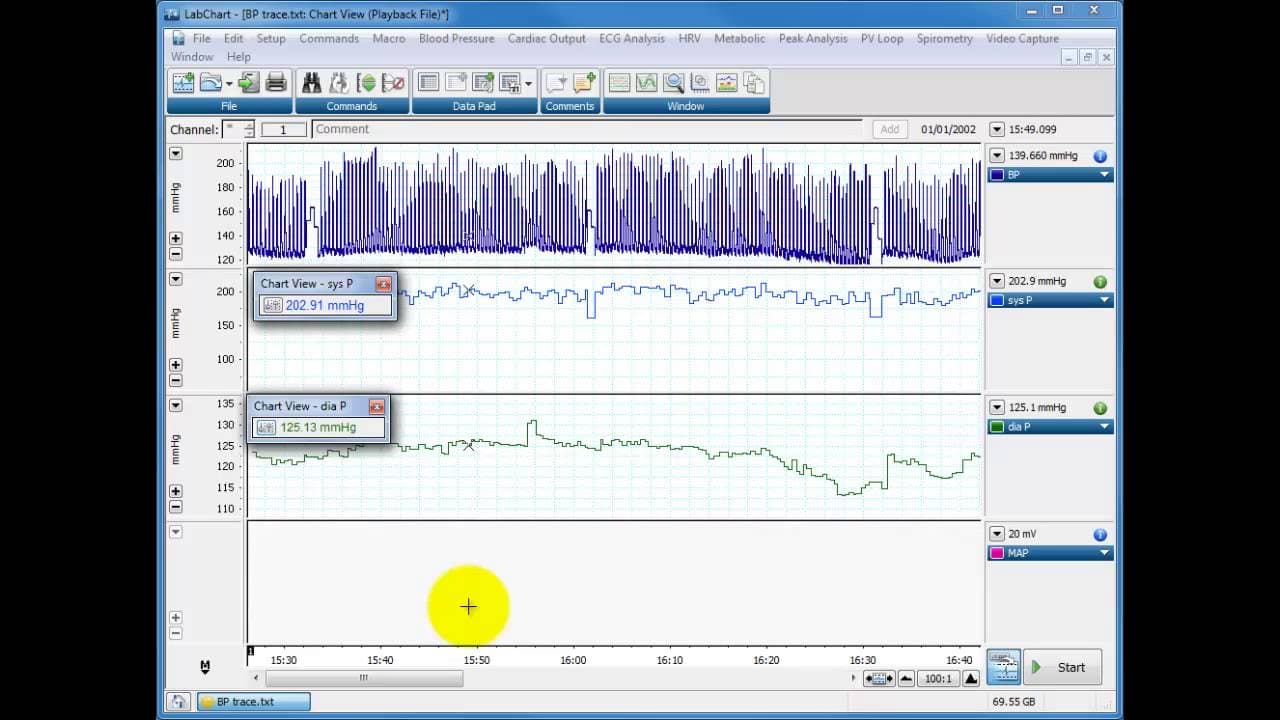
To calculate systolic, diastolic, and mean arterial pressure (MAP) from a blood pressure trace, set up three channels in Lab Chart for each measurement. Use cyclic measurements to detect maximum for systolic, minimum for diastolic, and apply the formula MAP = (1/3 × systolic) + (2/3 × diastolic). Adjust detection settings to ensure accuracy and verify results for reliable data.
Transcript
hello a few people have come to see me and some people have emailed me saying they've got a blood pressure trace from a finna press and they are unable to get good systolic means systolic mean diastolic and of course then mean arterial pressure from this trace of course I've not shown this in detail I've implied how it can be done and elsewhere but... Read More
Key Insights
- 💨 Lab Chart software offers a convenient way to extract precise blood pressure measurements from a finger pressure trace.
- 🩸 Accurate blood pressure measurement requires proper channel setup and adjustment of detection settings.
- ❓ Mean arterial pressure is not simply the average of systolic and diastolic pressures but follows a specific equation.
- ❓ Confirming the correctness of the extracted data is vital before using it for analysis or presentation.
- 🩸 Understanding the software's features and functions can help researchers obtain reliable blood pressure measurements.
- 😥 Standard binning techniques can be employed to select specific data points for analysis and presentation.
- 😫 Proper scaling and fit of the data set indicate the accuracy of the extracted blood pressure measurements.
Install to Summarize YouTube Videos and Get Transcripts
Explore YouTube Video Summarizer or Get YouTube Transcript Extractor
Questions & Answers
Q: How do you calculate systolic, diastolic, and mean arterial pressure from a blood pressure trace?
In LabChart, add three channels for systolic pressure, diastolic pressure, and mean arterial pressure. Configure cyclic measurements to track the maximum for systolic pressure, the minimum for diastolic pressure, and one-third systolic plus two-thirds diastolic for mean arterial pressure.
Q: How do you set up the systolic pressure channel in LabChart?
Choose Cyclic Measurements, select the channel containing the finger pulse pressure trace, and set the measurement to Maximum. Select the Finger Pulse preset, adjust detection until every pulse is recognized, and set the result to one decimal place.
Q: What detection setting should be used for a finger pressure trace?
Moving the detection threshold to around 1–2 standard deviations in inflection is described as fairly safe for most settings. Going lower risks detecting aberrant peaks, so inspect the entire trace for extra or missed peaks.
Q: How do you configure the diastolic pressure channel?
Choose Cyclic Measurements and Blood Pressure, then select Minimum with the Finger Pulse preset. Because the described software bug may place the pulse marker on the maximum, open Customize and set the trigger to Minimum.
Q: What equation is used to calculate mean arterial pressure?
Mean arterial pressure is calculated as one-third systolic pressure plus two-thirds diastolic pressure. It is not the simple average of systolic and diastolic pressure.
Q: How do you set up mean arterial pressure in LabChart?
Open Cyclic Measurements, choose Blood Pressure, and select the option corresponding to one-third systolic plus two-thirds diastolic. Use the Finger Pulse preset, confirm that individual peaks are detected, and set the result to one decimal place.
Q: How can you verify that the calculated pressure channels are correct?
Zoom in and confirm that single peaks and troughs are being detected without extra markers, then compare the calculated values with the original trace. In the example, systolic pressure is between 190 and 200 in one section, while mean arterial pressure is expected and displayed at around 150.
Q: How can the extracted blood pressure measurements be selected for analysis?
Use standard binning by placing a marker at a time point and counting from it or by selecting the desired points. After zooming out and autoscaling, also confirm that drops in the calculated channels align with drops in the original trace.
Summary & Key Takeaways
-
The content provides a step-by-step guide on how to extract blood pressure measurements from a finger pressure trace using Lab Chart software.
-
The tutorial covers setting up channels for systolic pressure, diastolic pressure, and mean arterial pressure.
-
The process involves adjusting detection settings to ensure accurate measurement and confirming the correctness of the extracted data.
Read in Other Languages (beta)
Share This Summary 📚
Summarize YouTube Videos and Get Video Transcripts with 1-Click
Try YouTube Summary with ChatGPT & Claude or YouTube Transcript Generator
Explore More Summaries from Dory Video 📚





Summarize YouTube Videos and Get Video Transcripts with 1-Click
Try YouTube Summary with ChatGPT & Claude or YouTube Transcript Generator