Products
Features
YouTube Video Summarizer
Summarize YouTube videos
Web & PDF Highlighter
Highlight web pages & PDFs
Chat with PDF
Ask any PDF questions with AI
Ask AI Clone
Chat with your highlights & memories
Audio Transcriber
Transcribe audio files to text
Glasp Reader
Read and highlight articles
Kindle Highlight Export
Export your Kindle highlights
Idea Hatch
Hatch ideas from your highlights
Integrations
Obsidian Plugin
Notion Integration
Pocket Integration
Instapaper Integration
Medium Integration
Readwise Integration
Snipd Integration
Hypothesis Integration
Apps & Extensions
Chrome Extension
Safari Extension
Edge Add-ons
Firefox Add-ons
iOS App
Android App
Discover
Discover
Ideas
Discover new ideas and insights
Articles
Curated articles and insights
Books
Book recommendations by great minds
Posts
Essays and notes from readers
Quotes
Inspiring quotes collection
Videos
Curated videos and summaries
Explore Glasp
Glasp Story
How we grew from 0 to 3 million users
Glasp Newsletter
Weekly insights and updates
Glasp Talk
Interview series with great minds
Glasp Blog
Latest news and articles
Glasp Use Cases
Learn how others use Glasp
Build & Support
Glasp API
Access Glasp's API for developers
MCP Connector
Connect Glasp to Claude & ChatGPT
Community
Glasp Reddit Community
Students
Student discount and benefits
FAQs
Frequently Asked Questions
AboutPricing
DashboardLog inSign up

How to Perform Linear Regression in GraphPad Prism

25.8K views
•
April 12, 2019
by
Dory Video
YouTube video player
How to Perform Linear Regression in GraphPad Prism

TL;DR

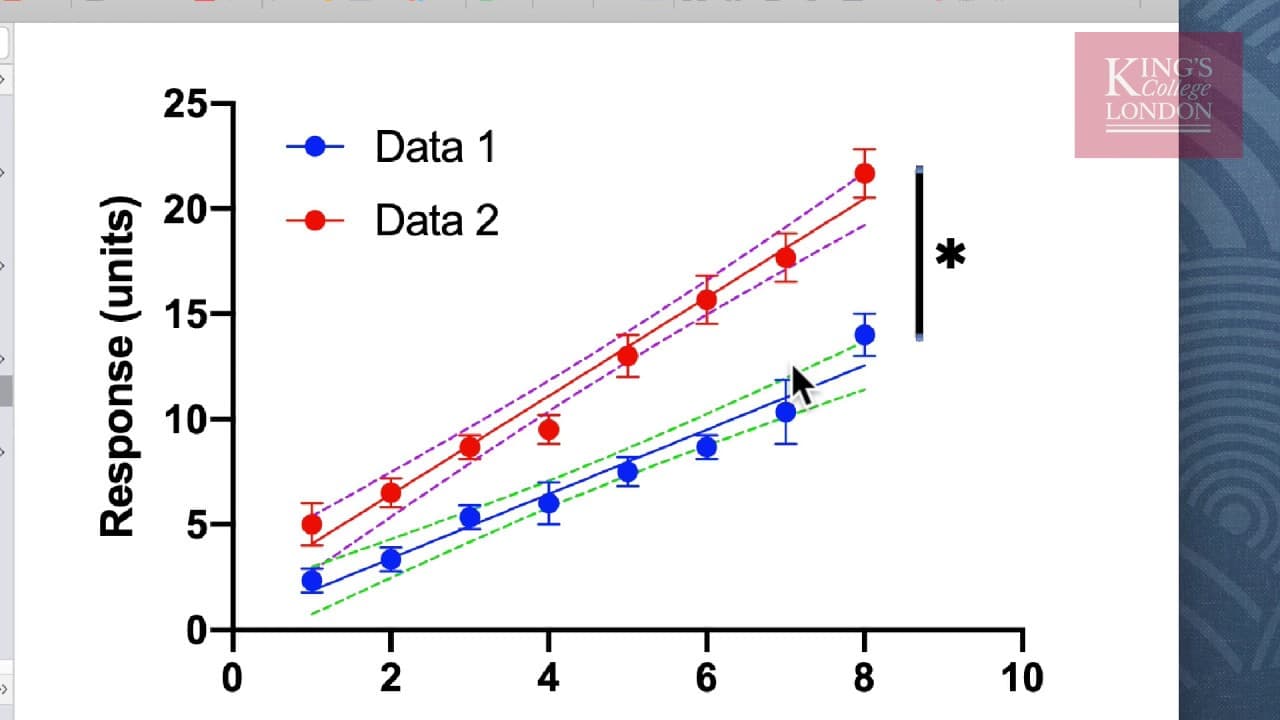
To perform linear regression in GraphPad Prism, access the linear regression tool from the analysis menu, select your parameters, and check the slopes of your datasets against zero for statistical significance. The software provides visual graphs with confidence intervals and interpretable results, making it easy to determine if the slopes of different datasets are significantly different.

Transcript

hello I'm James Clark from King's College London and in this short video I'm going to run through the steps needed to undertake linear regression analysis of a data set in graphpad prism prism allows you to analyze linear regression from either a single or multiple data sets with shared or individual x axis in this example we've used data from a fi... Read More

Key Insights

  • 👻 GraphPad Prism offers a linear regression analysis tool that allows for the comparison of slopes and intercepts.
  • 🫥 The software provides options for graphing confidence intervals and constraints on the regression line.
  • 😫 Linear regression results are displayed in a tabular format, showing the r-squared value, F value, and p-value for each data set.
  • ❓ Prism offers a commentary feature that explains the results in plain English.

Install to Summarize YouTube Videos and Get Transcripts

Explore YouTube Video Summarizer or Get YouTube Transcript Extractor

Questions & Answers

Q: What types of data sets can be analyzed using GraphPad Prism?

GraphPad Prism allows for the analysis of both single and multiple data sets, with the option to use shared or individual x-axis.

Q: How can the relationship between variables be visually represented in GraphPad Prism?

GraphPad Prism allows you to graph your data as scatterplots, with the x-axis representing time and the y-axis representing the response units.

Q: What is the purpose of performing linear regression analysis?

Linear regression analysis helps determine if there is a correlation between variables and allows for the comparison of slopes and intercepts.

Q: How can missing data be handled in linear regression analysis?

GraphPad Prism can handle missing data by considering each replicate Y value as an individual point when calculating the regression.

Summary & Key Takeaways

  • GraphPad Prism allows for linear regression analysis of single or multiple data sets with shared or individual x-axis.

  • The example data set used in this tutorial includes data from two groups with three replicates for each time point.

  • The tutorial demonstrates how to perform linear regression analysis, compare slopes of the lines, and determine if the two data sets are different in their actions.


Read in Other Languages (beta)

English

Share This Summary 📚

Summarize YouTube Videos and Get Video Transcripts with 1-Click

Download browser extensions on:

Try YouTube Summary with ChatGPT & Claude or YouTube Transcript Generator

Explore More Summaries from Dory Video 📚

Roland Cloud Anthology 1987 - Sampled D50 LA synth thumbnail
Roland Cloud Anthology 1987 - Sampled D50 LA synth
Dory Video
UVI String Machines (Expansion for UVI Workstation) thumbnail
UVI String Machines (Expansion for UVI Workstation)
Dory Video
Playing Vienna Instruments (VSL) with a ROLI Seaboard RISE thumbnail
Playing Vienna Instruments (VSL) with a ROLI Seaboard RISE
Dory Video
WavesFactory MERCURY Piano for Kontakt thumbnail
WavesFactory MERCURY Piano for Kontakt
Dory Video
Setting up multi instrument layers in Kontact thumbnail
Setting up multi instrument layers in Kontact
Dory Video
Graphpad Prism - using the layout tool to publish your data thumbnail
Graphpad Prism - using the layout tool to publish your data
Dory Video

Summarize YouTube Videos and Get Video Transcripts with 1-Click

Download browser extensions on:

Try YouTube Summary with ChatGPT & Claude or YouTube Transcript Generator

Apps & Extensions

  • Chrome Extension
  • Safari Extension
  • Edge Add-ons
  • Firefox Add-ons
  • iOS App
  • Android App

Key Features

  • YouTube Video Summarizer
  • Web & PDF Summarizer
  • Web & PDF Highlighter
  • Chat with PDF
  • Ask AI Clone
  • Audio Transcriber
  • Glasp Reader
  • Kindle Highlight Export
  • Idea Hatch

Integrations

  • Obsidian Plugin
  • Notion Integration
  • Pocket Integration
  • Instapaper Integration
  • Medium Integration
  • Readwise Integration
  • Snipd Integration
  • Hypothesis Integration

More Features

  • APIs
  • MCP Connector
  • Blog & Post
  • Embed Links
  • Image Highlight
  • Personality Test
  • Quote Shots

Company

  • About us
  • Our Story
  • Blog
  • Community
  • FAQs
  • Job Board
  • Newsletter
  • Pricing
Terms

•

Privacy

•

Guidelines

© 2026 Glasp Inc. All rights reserved.