How to Analyze NASDAQ 100 Trading Patterns
TL;DR
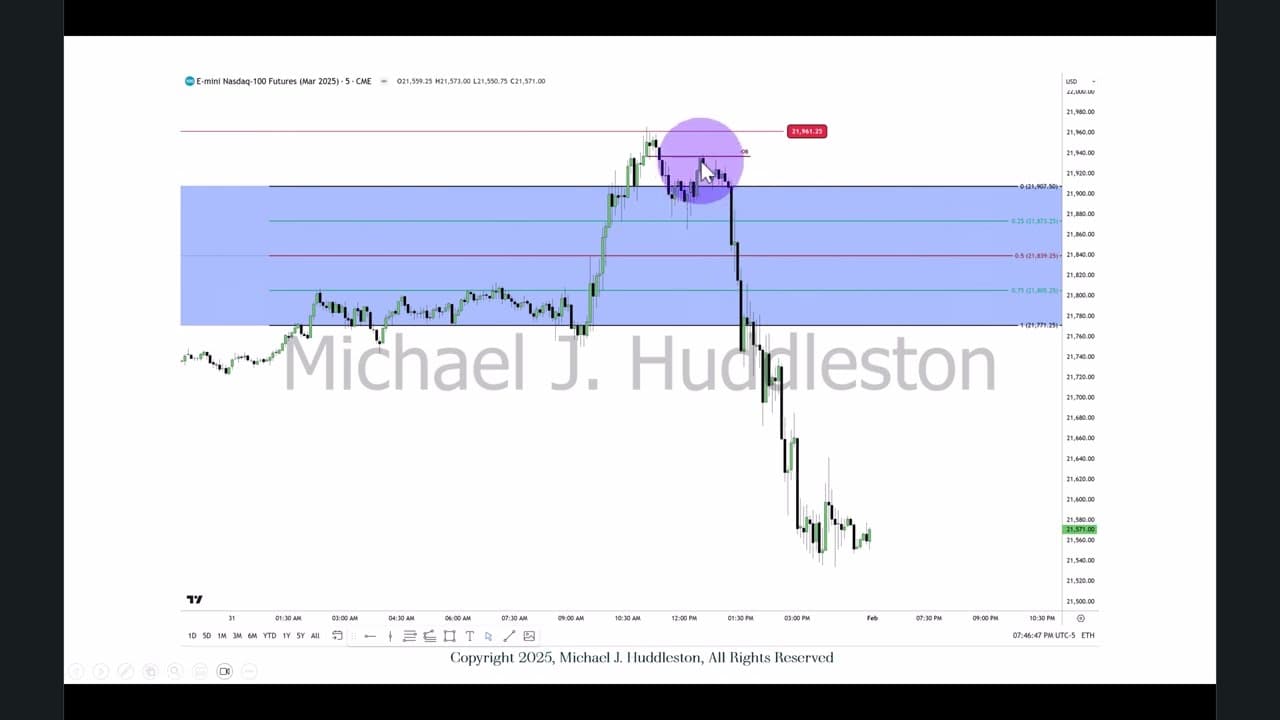
The key takeaway is identifying high-probability trading setups using candlestick patterns and market gaps. By analyzing the NASDAQ 100's weekly and daily charts, traders can determine potential market movements and liquidity draws. The video emphasizes the importance of understanding equilibrium price points and the role of volume imbalances in predicting market behavior.
Transcript
e hello folks welcome back so I'm a little tardy today I had a lot of uh curveballs thrown at me in January of 2025 and Saturday morning was no exception let's just put it that way so I'm just thankful I was able to get everything finished and taken care of and now it's kind of late here in my local time so I'm going to try to make this one brief b... Read More
Key Insights
- Equilibrium price points are crucial for predicting market movements.
- Volume imbalances indicate potential market gaps and liquidity draws.
- Candlestick patterns provide insights into market highs and lows.
- The NASDAQ 100's weekly chart can reveal significant trading opportunities.
- Analyzing market gaps helps identify potential buy and sell zones.
- Weekly range retracement patterns can guide trading strategies.
- Understanding order blocks can lead to high-probability trade setups.
- Market liquidity pools can act as magnets for price movements.
Install to Summarize YouTube Videos and Get Transcripts
Explore YouTube Video Summarizer or Get YouTube Transcript Extractor
Questions & Answers
Q: How to identify equilibrium price points in trading?
Equilibrium price points are identified by measuring the midpoint between the high and low of a candlestick. This midpoint helps traders predict potential market movements. By focusing on these points, traders can determine whether the market is likely to move upward or downward, providing a basis for trading decisions.
Q: What are volume imbalances in trading?
Volume imbalances occur when there is a disparity between buying and selling volumes, leading to market gaps. These imbalances can indicate potential areas of liquidity draws, which traders can use to identify buy and sell zones. Recognizing these imbalances is crucial for understanding market dynamics and predicting price movements.
Q: Why are candlestick patterns important in trading?
Candlestick patterns provide insights into market highs and lows, helping traders identify potential entry and exit points. By analyzing these patterns, traders can understand market sentiment and predict future price movements. Recognizing specific patterns, such as doji or engulfing patterns, can guide trading strategies and improve decision-making.
Q: How to use the NASDAQ 100's weekly chart for trading?
The NASDAQ 100's weekly chart can reveal significant trading opportunities by highlighting overall market trends and potential retracement patterns. Traders can use the chart to identify weekly range retracements, which often occur between 20-30% of the weekly range. This analysis helps in predicting market behavior and planning trades accordingly.
Q: What role do market gaps play in trading?
Market gaps occur when there is a significant difference between the closing price of one period and the opening price of the next. These gaps can indicate potential areas of liquidity draws and serve as buy or sell zones. Understanding and analyzing these gaps help traders identify high-probability trading setups and make informed decisions.
Q: How do order blocks affect trading strategies?
Order blocks are areas where significant buying or selling orders have been placed, often leading to market reversals. Identifying these blocks can help traders find high-probability trade setups. By recognizing order blocks, traders can anticipate potential price movements and adjust their strategies to capitalize on market opportunities.
Q: What is the significance of liquidity pools in trading?
Liquidity pools are areas in the market where there is a concentration of buy or sell orders, often acting as magnets for price movements. These pools can provide traders with potential entry and exit points. Understanding the location and impact of liquidity pools helps traders anticipate market behavior and improve trading outcomes.
Q: When should traders focus on weekly range retracement patterns?
Traders should focus on weekly range retracement patterns when analyzing the overall market trend and planning their trading strategies. These patterns often occur between 20-30% of the weekly range and can provide insights into potential market reversals or continuations. By understanding these patterns, traders can make informed decisions and optimize their trading performance.
Summary & Key Takeaways
-
Identifying equilibrium price points on candlestick charts helps predict market movements. Traders should focus on volume imbalances and market gaps to understand potential liquidity draws. Analyzing the NASDAQ 100's weekly chart can reveal significant trading opportunities, especially when considering weekly range retracement patterns.
-
Understanding market gaps and their relationship to buy and sell zones is crucial for trading. By identifying order blocks, traders can find high-probability trade setups. The video emphasizes the importance of studying candlestick patterns to determine market highs and lows, which can guide trading strategies.
-
Liquidity pools in the market can act as magnets for price movements, providing traders with potential entry and exit points. The video highlights the significance of analyzing the NASDAQ 100's daily and weekly charts to identify potential trading opportunities and improve trading outcomes.
Read in Other Languages (beta)
Share This Summary 📚
Summarize YouTube Videos and Get Video Transcripts with 1-Click
Try YouTube Summary with ChatGPT & Claude or YouTube Transcript Generator
Explore More Summaries from The Inner Circle Trader 📚



Summarize YouTube Videos and Get Video Transcripts with 1-Click
Try YouTube Summary with ChatGPT & Claude or YouTube Transcript Generator