How to Find One-Minute Scalping Entries
TL;DR
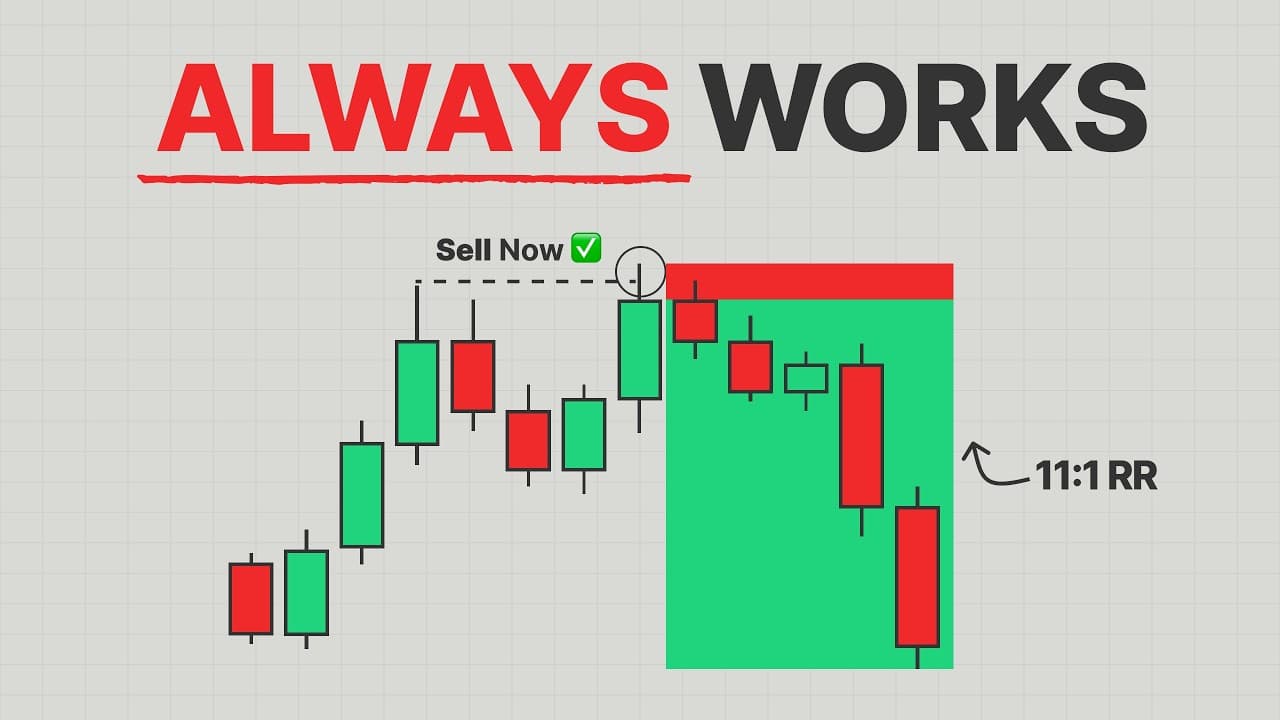
Use the 50 or 200 EMA to choose direction, then seek a pattern combining weakness at the move’s origin, strength through recent lows or highs, and an imbalance or key level. Mark the relevant area with one rectangle, use it to organize confirmation and stop placement, and target price movement away from it while favoring a small number of high-quality setups.
Transcript
This is the only one minute scalping strategy you will ever need. It's built from seven years of experience and based on just three steps using only one rectangle and one pattern to catch sniper highly waterist trades like these. This miniourse gives you everything you need in under 30 minutes to take your first trade plus tips to get even higher w... Read More
Key Insights
- Direction is established mechanically by using either the 50 or 200 EMA, although candle continuity theory, market structure, and higher-time-frame key levels are also presented as acceptable alternatives for determining whether to seek long or short trades.
- Price above the moving average supports long setups, while price below the moving average supports short setups. The method also requires valid market structure to form on the relevant side rather than treating the average alone as a complete entry signal.
- Strength is a decisive candle close through a key high or low, preferably with displacement. This behavior signals that the level has been disrespected and is treated as evidence favoring continuation beyond that part of the market structure.
- Weakness is a failure to close decisively beyond a key level, such as moving below a low and then closing back above it. The method interprets this failed break as evidence that a reversal may occur instead of structural continuation.
- The featured pattern combines weakness at the origin of a move with strength through the latest one or two structural levels. An imbalance or another key level created during the displacement then becomes the area where a continuation setup may develop.
- The rectangle represents the entire trade framework: entry confirmation occurs inside or out of the marked area, the stop loss is positioned above or below it, and the take-profit objective is placed away from the rectangle.
- Higher-probability reference points include highs and lows inside or near imbalances, session highs and lows, structural levels belonging to the featured pattern, and reversal points formed after price becomes overextended relative to the moving average.
- Quality is prioritized over trading frequency because more trades do not automatically produce more money. The example given states that 10 trades with a 60% win rate can outperform 100 trades with a 50% win rate, supporting selective execution.
Install to Summarize YouTube Videos and Get Transcripts
Explore YouTube Video Summarizer or Get YouTube Transcript Extractor
Questions & Answers
Q: How do you determine direction for one-minute scalping?
Direction can be determined with either the 50 or 200 exponential moving average, which the strategy presents as a simple and mechanical option. When price is above the selected average, the trader looks for long setups and valid structure above it. When price is below the average, the focus shifts to short setups and valid structure below it. Market structure, candle continuity theory, or higher-time-frame key levels may also be used.
Q: What do strength and weakness mean in this scalping strategy?
Strength means price decisively closes through a key high or low, ideally with displacement, indicating that the level has been disrespected and continuation may follow. Weakness means price fails to close decisively beyond the level, such as trading below a low before closing back above it. That failed break suggests there was no confirmed structural break and that a reversal may be possible.
Q: What pattern should traders find before entering?
The pattern combines weakness at the origin of a move, strength through recent structural levels, and the creation of an imbalance or another key level. In a bearish example, price retraces toward a prior high without displacing above it, then moves lower and strongly breaks the latest one or two lows. When price later returns into the imbalance, the trader begins looking for continuation confirmation.
Q: How is the rectangle used to plan a scalp trade?
The rectangle is used to organize the entry, risk, and profit objective within one marked area. Entry confirmation is expected either inside the rectangle or as price emerges from it. The stop loss is placed above or below the rectangle, depending on trade direction, while the take-profit objective is positioned away from it. The rectangle therefore acts as the central reference for the full trading plan.
Q: Which highs and lows offer higher-probability setups?
The strategy prioritizes highs and lows located inside or near imbalances, session highs and lows, market-structure highs and lows that belong to the featured weakness-and-strength pattern, and reversal points created after an overextended move. An overextended reversal occurs after price has moved aggressively away from the moving average and then turns to rebalance the range or create a more valid retracement.
Q: Why does the strategy favor fewer trades?
The approach favors quality over quantity because a larger number of trades does not automatically lead to more money. The transcript illustrates this with 10 trades at a 60% win rate compared with 100 trades at a 50% win rate, stating that the smaller, more selective sample can outperform. Restricting attention to the defined pattern is intended to filter lower-quality opportunities and limit losing trades.
Q: How are the 15-minute and one-minute charts aligned?
The purpose of the three-step framework is to identify high-probability 15-minute liquidity sweeps, also described as fakeouts, while using the one-minute chart for execution. This creates a time-frame alignment in which the broader 15-minute event supplies context and the one-minute chart supplies more precise observation. The supplied transcript introduces this relationship but ends before fully describing each execution step.
Q: What reward-to-risk profile does the strategy target?
The strategy aims for trades with higher reward relative to risk rather than routinely settling for 1:1 or 2:1 outcomes and immediately moving to break even. The presenter says the method is designed to pursue 5:1 and 10:1 opportunities and mentions personally taken examples reaching 10:1 and 15:1. These figures are stated goals and examples, not guarantees of future results.
Summary & Key Takeaways
-
The strategy begins by establishing directional bias, with the 50 or 200 exponential moving average offered as the simplest mechanical method. Price above the average supports looking for long setups, while price below it supports shorts, provided valid structure appears on the corresponding side of the average.
-
The central pattern combines weakness and strength. Weakness occurs when price tests a key high or low but fails to close decisively beyond it. Strength occurs when price closes through a key level, preferably with displacement. The setup aligns both behaviors with an imbalance or another relevant key level.
-
One rectangle organizes the complete trade plan. Confirmation is associated with price action inside or emerging from the marked area, the stop goes beyond the rectangle, and the target lies away from it. The approach prioritizes selective setups, high reward-to-risk potential, and alignment between the 15-minute and one-minute charts.
Read in Other Languages (beta)
Share This Summary 📚
Summarize YouTube Videos and Get Video Transcripts with 1-Click
Try YouTube Summary with ChatGPT & Claude or YouTube Transcript Generator
Explore More Summaries from Mulham Trading 📚
Summarize YouTube Videos and Get Video Transcripts with 1-Click
Try YouTube Summary with ChatGPT & Claude or YouTube Transcript Generator