How to Draw Support and Resistance Levels Correctly
TL;DR
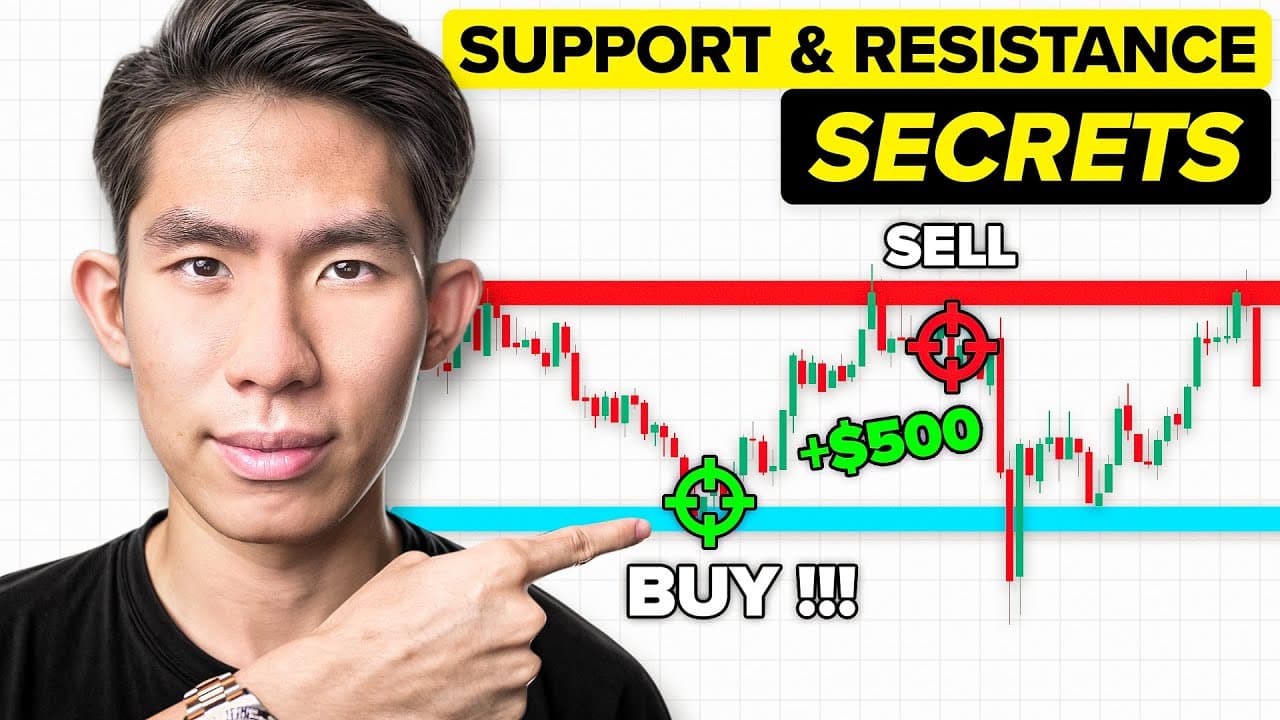
Draw support and resistance correctly by marking nearby areas where price has repeatedly reversed or moved significantly away from a swing high or low. Three rejections can confirm a strong level, while broken support can become resistance and broken resistance can become support. For trades, wait until a key level, a reversal candlestick pattern, and a moving average crossover align. Read on for the four marking rules and exact entry and exit process.
Transcript
in this video I want to show you how to correctly draw your support and resistance levels so that your charts do not look like this oh what the hell is even that support and resistance or key levels are one of the most important things that you must muster when trading but 99 of Traders are still getting it wrong why is it so important because if y... Read More
Key Insights
- Support and resistance are among the most important concepts to master in trading, yet 99% of traders get them wrong, usually by drawing far too many lines and confusing themselves instead of simplifying their analysis.
- The first rule for a valid level is multiple rejections: if price reverses off the same area three times, that repeated rejection confirms a strong support or resistance level worth marking on the chart.
- When multiple rejections have not formed yet, a level is still valid if price moves significantly away from a swing high or swing low, not just a tiny bit, before reversing back in the other direction.
- A single level can act as both support and resistance. Once price breaks through a support level and retests it from below, that former support then acts as resistance, and the relationship reverses.
- Levels must be near the current price to matter. Marking levels that are far away, from months or years ago, is irrelevant, described as ancient history and dinosaurs that only add confusing clutter.
- Support and resistance are areas, not single lines. Price often retests an entire zone rather than one exact line, so the whole region around a level should be treated as the support or resistance area.
- Trading a level requires three confirmations before entering: price sitting at a key level, a reversal candlestick pattern such as an evening star or bullish engulfing, and a moving average crossover all lining up together.
- Stop losses should be placed above resistance or below support with breathing room, not super tight, because price can retest the level before reversing. Take profit is set at the next key level.
Install to Summarize YouTube Videos and Get Transcripts
Explore YouTube Video Summarizer or Get YouTube Transcript Extractor
Questions & Answers
Q: How do you correctly draw support and resistance levels?
Mark an area when price repeatedly rejects it, such as reversing from the same level three times. If repeated rejections have not formed, use a swing high or low from which price moved away significantly. Keep levels near the current price and treat them as areas rather than exact lines.
Q: What are the four rules for identifying valid support and resistance levels?
Look for multiple rejections, or a significant move away from a swing high or swing low. Remember that broken support can become resistance and broken resistance can become support. Finally, mark levels near the current price instead of distant historical levels.
Q: What is the multiple-rejections rule?
A level becomes worth marking when price repeatedly touches the same area and reverses. The transcript demonstrates support with price reversing upward from an area three times and resistance with repeated downward reversals from another area.
Q: How can you identify a level without multiple rejections?
Find a swing high or swing low from which price moves away significantly rather than only a tiny amount. A significant decline from a swing high can identify resistance, while a significant rise from a swing low can identify support.
Q: Why does support become resistance, and resistance become support?
When price breaks through support and later retests that area from below, the former support can act as resistance. The reverse also applies: a broken resistance level can later act as support.
Q: Why should support and resistance levels be close to the current price?
Nearby levels are the ones relevant to the current price action. Drawing levels from months, one year, or even 10 years ago can clutter the chart and make analysis confusing. A distant support level becomes relevant when price breaks lower and begins moving toward it.
Q: What confirmations should you wait for before entering a trade?
Wait for three confirmations: price at a key support or resistance area, a reversal candlestick pattern, and a moving average crossover. Examples in the transcript include an evening star at resistance for a sell and a bullish engulfing candlestick at support for a buy.
Q: Where should stop loss and take profit be placed?
For a sell, place the stop loss above resistance; for a buy, place it below support. Give the stop loss breathing room because price may retest the area before reversing. Set take profit at the next key support or resistance level.
Summary & Key Takeaways
-
Support and resistance levels are where price repeatedly reverses, and correctly identifying them can create high win-rate trade opportunities. The most common mistake is drawing too many lines, which makes charts confusing rather than clarifying analysis. The whole purpose of key levels is to simplify decision-making.
-
Four secret rules define valid levels: multiple rejections at the same area, price moving significantly away from a swing high or low, the fact that a broken support becomes resistance and vice versa, and keeping levels near the current price rather than far-away historical zones.
-
To trade these levels, wait for three confirmations before entering: price at a key level, a reversal candlestick pattern like an evening star or bullish engulfing, and a moving average crossover. Place a stop loss beyond the level with breathing room and set take profit at the next key level.
Read in Other Languages (beta)
Share This Summary 📚
Summarize YouTube Videos and Get Video Transcripts with 1-Click
Try YouTube Summary with ChatGPT & Claude or YouTube Transcript Generator
Explore More Summaries from The Trading Geek 📚





Summarize YouTube Videos and Get Video Transcripts with 1-Click
Try YouTube Summary with ChatGPT & Claude or YouTube Transcript Generator