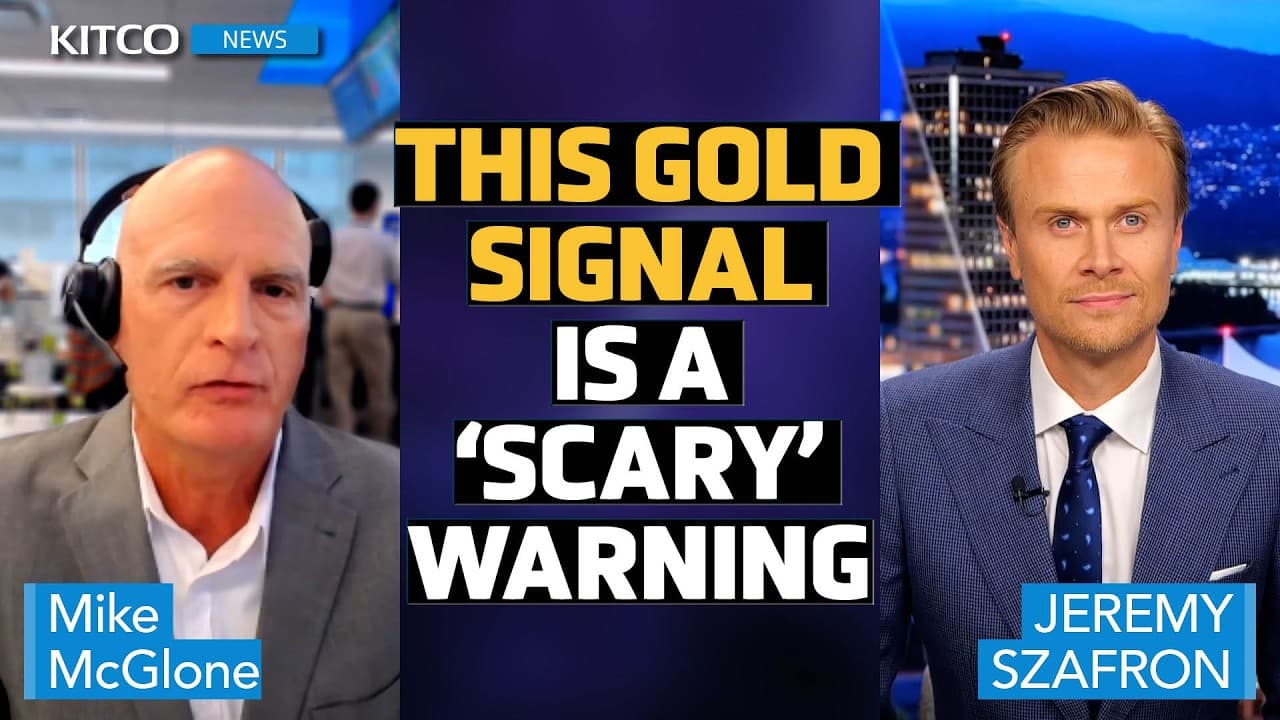
Why Does Bloomberg Strategist Mike McGlone Say Gold Near $4,000 Is a Warning for Q4?
TL;DR
Gold nearing $4,000 is a warning because its 46% annual surge coincides with weak crude oil and industrial metals and unusually low stock-market volatility. Bloomberg strategist Mike McGlone sees resistance around $4,000 and support near $3,500, with gold potentially anticipating economic or financial stress that equities have not reflected. Read on to understand the signals from volatility, ETF flows, positioning, oil, and copper.
Transcript
Hey everyone, welcome back. I'm Jerry Saffron. It's a volatile day in the markets as Washington cares towards a government shutdown. So far, the president says it's likely, but of course, this developing story will continue to follow. And you can see the reaction right here in the price of gold. A sharp spike this morning as investors run for safet... Read More
Key Insights
- Gold is approaching $4,000 after rising 46% during the year, its strongest annual performance since 1979. McGlone considers the advance unusually stretched relative to normal moving averages and says $4,000 represents significant resistance rather than an attractive level for most investors to initiate new long positions.
- S&P 500 volatility is unusually subdued while gold is setting records. The index’s 60-day volatility is below 9%, its lowest level since before COVID, leaving limited room to decline and creating the risk that even a modest reversion could affect equities and commodities.
- Gold is expected to trade between approximately $3,500 and $4,000 in the near term. McGlone identifies $4,000 as resistance and $3,500, near April’s low, as support, while allowing that both boundaries could be tested during the fourth quarter without changing the broader thesis.
- Gold ETF holdings are rising after four consecutive years of outflows. Bloomberg’s measure shows total inflows up almost 20% during the year, compared with an increase of nearly 30% in 2020, indicating that longer-term investors have become important participants in the rally.
- Managed-money positioning is below its previous extreme despite gold’s advance. Net positions represent roughly 33% of COMEX open interest, compared with about 45% during the prior year’s run toward $2,600, suggesting less excessive speculative bullishness than the price alone might imply.
- Central banks are described as the deepest-pocketed buyers supporting gold. Their purchases are difficult to measure, while escalating wars in Europe and statements about Ukraine contribute to what McGlone calls an almost perfect storm for gold, even though current prices appear overbought.
- The gold-to-oil ratio is flashing an unusually severe macroeconomic signal. One ounce of gold buys about 61 barrels of WTI crude oil, while the highest previous year-end close was 39, recorded in 1933 and 2020, years McGlone characterizes as unfavorable for markets.
- Copper’s economic signal is becoming less reliable because significant supply disruptions are supporting prices. Copper supply disruptions are estimated near 10% this year rather than the more typical 5%, but McGlone argues that sustained equity resilience remains essential because copper is still riding the stock market’s beta wave.
Install to Summarize YouTube Videos and Get Transcripts
Explore YouTube Video Summarizer or Get YouTube Transcript Extractor
Questions & Answers
Q: Why does Mike McGlone consider gold near $4,000 a warning for Q4?
Gold is approaching $4,000 after rising 46% during the year, even as crude oil and industrial metals weaken. McGlone views that divergence as a warning that demand for a store of value is rising while economically sensitive commodities signal weaker demand. Exceptionally low stock-market volatility adds to his concern that gold may be anticipating stress not yet reflected in equities.
Q: What gold price range does McGlone expect during the fourth quarter?
McGlone expects gold to trade broadly between $3,500 and $4,000. He identifies $4,000 as significant resistance because gold is stretched relative to normal moving averages, while $3,500, near April’s low, represents support. He says both boundaries could be tested during Q4 without changing the broader thesis.
Q: What could happen to gold if the stock market remains resilient?
If equities remain resilient and volatility stays low, McGlone says gold could decline 8% to 10% toward approximately $3,400 or $3,500. Even after that retreat, gold would remain up by more than one-third for the year.
Q: Why is unusually low S&P 500 volatility important to the gold outlook?
The S&P 500’s 60-day volatility is below 9%, its lowest level since before COVID. McGlone argues that such complacency leaves little room for volatility to decline further, especially entering a more volatile part of the year. A rise in volatility could expose the market stress that gold’s rally may already be signaling.
Q: What do gold ETF inflows reveal about the rally?
Bloomberg’s measure shows total gold ETF inflows up almost 20% during the year after four consecutive years of outflows. The last strong inflow year discussed was 2020, when holdings increased almost 30%. McGlone presents this reversal as evidence that longer-term investors have become important participants in the rally.
Q: Is managed-money positioning in gold excessively bullish?
Managed-money net positions represent roughly 33% of COMEX open interest. That is below the approximately 45% reached during the previous year’s advance toward $2,600. The comparison suggests speculative positioning is not as extreme as the gold price alone might imply.
Q: What does the gold-to-oil ratio signal about the economy?
One ounce of gold buys about 61 barrels of WTI crude oil, reflecting strong demand for gold alongside weak demand for a major industrial commodity. The highest previous year-end close cited was 39, recorded in 1933 and 2020. McGlone considers the unusually high ratio a severe macroeconomic warning.
Q: Why could copper fall despite major supply disruptions?
Copper supply disruptions are estimated near 10% this year, compared with a more typical 5%, helping support its price. McGlone nevertheless argues that copper is riding the stock market’s strength and could fall if equities weaken. China’s low yield and declining iron ore prices add to his concern about deflationary pressure.
Summary & Key Takeaways
-
Gold’s 46% annual rise toward $4,000 has occurred while 60-day S&P 500 volatility sits below 9%, its lowest level since before COVID. McGlone considers that combination disconcerting because gold may be anticipating economic or financial stress while equity investors remain unusually complacent entering the fourth quarter.
-
McGlone expects gold to encounter significant resistance around $4,000 and support near $3,500, April’s low. If stocks remain resilient and volatility stays subdued, gold could retreat 8% to 10% toward $3,400 or $3,500. A rise in volatility, however, could strengthen gold’s macroeconomic warning.
-
Weak crude oil and strong gold suggest limited demand for the world’s most significant commodity alongside heavy demand for an ancient store of value. Copper remains supported by equity-market strength and supply disruptions, but McGlone argues that weaker stocks could make commodities tumble together, with China’s low yield and falling iron ore adding concern.
Read in Other Languages (beta)
Share This Summary 📚
Summarize YouTube Videos and Get Video Transcripts with 1-Click
Try YouTube Summary with ChatGPT & Claude or YouTube Transcript Generator
Explore More Summaries from Kitco NEWS 📚



Summarize YouTube Videos and Get Video Transcripts with 1-Click
Try YouTube Summary with ChatGPT & Claude or YouTube Transcript Generator