How to Read Advanced Market Structure on Any Chart
TL;DR
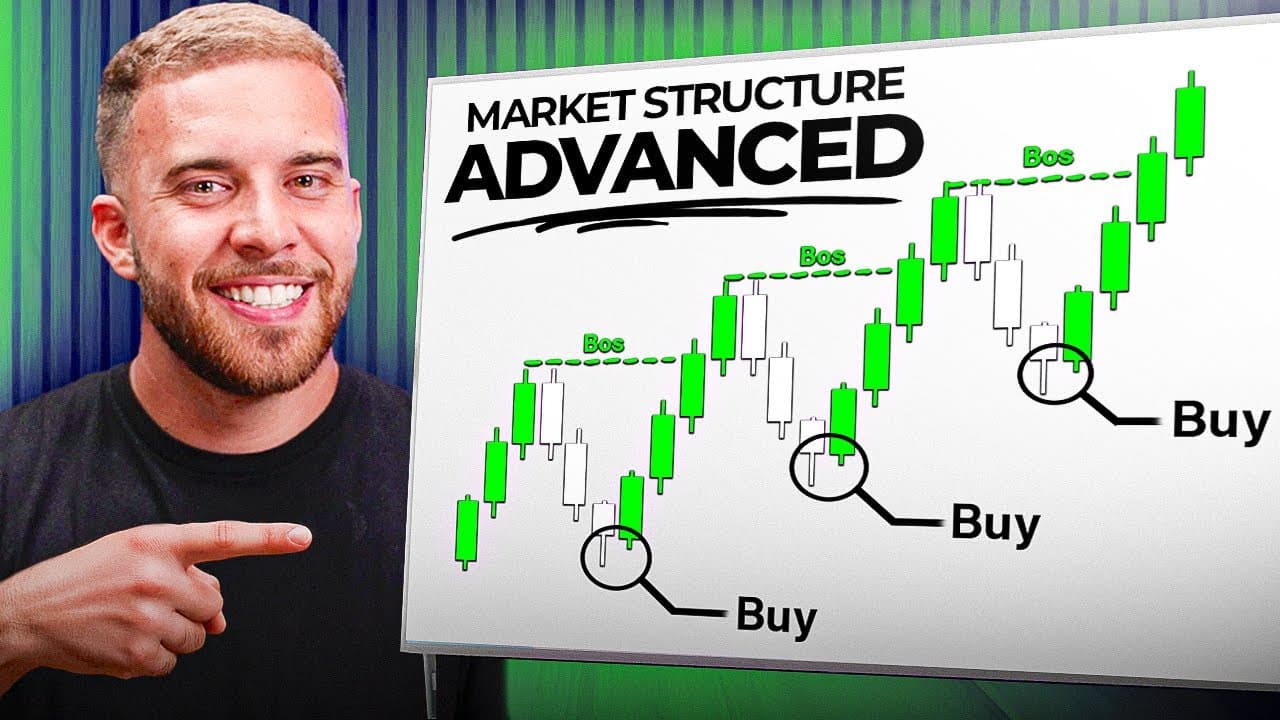
Market structure is defined by higher highs and higher lows in a bullish market, or lower highs and lower lows in a bearish one, and it stays valid until a candlestick body closes above or below one of those levels. Because every chart has structure, the currency pair, stock, crypto asset, or timeframe behind it is irrelevant. Highs and lows are marked at candle bodies, never at wicks.
Transcript
welcome ladies and gentlemen to the advanced Market structure video now we're going to get started right away this chart that you have in front of you right now very clearly you can tell that this is gbpnzd and that we are currently on the 4-Hour time frame and the market structure that you have in front of you is indicating to you that this Market... Read More
Key Insights
- Market structure is the one element that stays constant across every instrument and timeframe. With the pair and timeframe hidden, forex, stocks, crypto, and binaries all show the same readable structure, so the asset behind the chart does not change how the structure is interpreted.
- A bullish market is made of higher highs and higher lows, and having one without the other is impossible. Once a new higher high forms by a body close above the previous one, a new higher low must also be identified, and the same rule applies in reverse for lower lows and lower highs.
- The shift in structure is confirmed only by a candlestick body close above or below the marked level. Price can travel as close to that line as it wants and the structure remains unchanged, so wicks approaching or piercing the level do not count as a break.
- Higher highs and higher lows are drawn at candle bodies, not at wicks. Switching the chart from candlesticks to a line chart shows the structure sitting exactly at those body levels, which confirms the wicks are only the trail of where price traveled.
- The snake trick identifies the last swing point: take the head of the snake at the extreme of the move, follow the body back, and the sharp turn marks the last higher low or lower high. This mirrors how a snake changes direction by turning before moving the other way.
- The biggest mistake traders make is judging trend from the overall visual direction of the chart instead of from structure. A chart that looks like it is heading up can already be bearish if a candle body has closed under the higher low.
- The trend is identified by the market structure, and without structure the trend cannot be identified at all. This is compared to hunting: without footprints or tracks you cannot tell whether an animal is there or which way it went, and misreading the tracks means walking the opposite way.
- Ranging or choppy markets still contain market structure. Even if price stays in the same tight spot for weeks, months, or years, the structure inside that consolidation is still either bullish or bearish and can be read with the same higher high, higher low, lower high, lower low rules.
- A shift in structure counts no matter how small the break is. In the consolidation example, a body close just under the higher low is treated as a genuine structure shift because the market did shift structure, which then requires a new lower high to be marked with the snake trick.
Install to Summarize YouTube Videos and Get Transcripts
Explore YouTube Video Summarizer or Get YouTube Transcript Extractor
Questions & Answers
Q: What is market structure in trading?
Market structure is the arrangement of highs and lows on a chart that tells you whether a market is bullish or bearish. A bullish market consists of higher highs and higher lows, and a bearish market consists of lower lows and lower highs. It exists on anything that has a chart, including forex pairs, stocks, crypto markets, and binaries. When the pair name and timeframe are hidden from the chart, the structure is still fully readable, which is why it is described as everything in the market and the one thing that matters regardless of the instrument.
Q: How do you know if a market is bullish or bearish?
You identify the current higher high and the last higher low. If the market is trading between those two levels, it remains bullish. A market is bearish when it is contained between a lower high and a lower low. The direction only changes when a candlestick body closes above or below one of those marked levels. Judging by the general visual slope of the chart is the mistake most traders make: a chart heading up overall can already be bearish if price has body closed under the previous higher low.
Q: Why should highs and lows be marked at candle bodies instead of wicks?
Higher highs and higher lows are placed at the bodies of the candlesticks because that is where the market structure actually sits. If you erase the candlesticks and switch the chart to a line chart, the structure lines up exactly with those body levels. The wicks are only the trail showing where price traveled, not the structure itself. This matters because a structure shift is confirmed by a body close above or below the level, so marking wicks would give false breaks and false shifts.
Q: What is the snake trick for finding the last higher low?
The snake trick is a method for locating the last swing point. You take the head of the snake, which is the extreme point of the current move, follow the body of the snake back along the price path, and the level where it makes a sharp turn is the last higher low. The same method applied to a bearish move gives the last lower high. The analogy is that a snake wanting to move in a different direction goes forward, turns, then turns again, and the market turns the same way when it changes direction.
Q: When does market structure actually shift?
Structure shifts only when a candlestick body closes above the marked high or below the marked low. Until that happens, price can move anywhere inside the range, including right up to the line, and the structure stays the same. A body close above a higher high creates a new higher high, which then requires a new higher low to be marked. A body close under a higher low creates a new lower low, which then requires a new lower high. The size of the break does not matter: even a very small body close counts as a genuine shift.
Q: Does market structure change depending on the timeframe or currency pair?
No. The same reading applies everywhere. In the video the chart is shown as GBPNZD on the 4-hour, then AUDUSD on the 4-hour, then NZDUSD on the 15-minute, and with the labels zoomed out of view the viewer cannot tell which pair or timeframe is on screen. What stays visible and readable is the structure itself. Anything that has a chart, including stocks, crypto, and binaries, has market structure, so the advanced approach is to read structure and not care about the timeframe or the market behind it.
Q: Is there market structure inside a ranging or choppy market?
Yes. A somewhat experienced trader may look at a tight chart and call it consolidation, choppy, or ranging, and it may well be ranging, but there is still market structure inside that consolidation. Even if the market sits in the exact same spot for weeks, months, or years, the structure inside is either bullish or bearish. You apply the identical rules: mark the higher high and last higher low, watch for a body close through either level, then mark the new lower low and use the snake trick to find the new lower high.
Q: What is the most common mistake traders make when reading trend?
The most common mistake is pulling up a chart, seeing the overall movement heading up or down, and assuming the market is bullish or bearish on that basis alone. That is described as one of the biggest mistakes traders make, because they are not analyzing structure or trend correctly. The comparison given is hunting: a hunter follows an animal's footsteps, and if the tracks are read in the wrong direction the hunter walks the opposite way from the animal. Traders who misread structure do the same thing and dig themselves into a deeper hole.
Summary & Key Takeaways
-
Market structure works identically across every market and timeframe. When the chart labels are hidden, a viewer cannot tell whether the chart is GBPNZD on the 4-hour, AUDUSD on the 4-hour, or NZDUSD on the 15-minute, yet the structure still reads as clearly bullish or bearish. Anything that has a chart has market structure.
-
A bullish market consists of higher highs and higher lows, and it is impossible to have a bullish market without both. The higher high is the highest point of the current structure, and the last higher low is the last one formed, not the lowest low. The market stays bullish while price remains between those two levels.
-
The snake trick locates the last higher low or lower high: start at the head of the snake, which is the extreme point of the move, follow the body back, and mark the level where the move makes its sharp turn. A snake changes direction by turning, and the market turns the same way when it reverses.
-
(Content reviewed on 2026-08-27.)
Read in Other Languages (beta)
Share This Summary 📚
Summarize YouTube Videos and Get Video Transcripts with 1-Click
Try YouTube Summary with ChatGPT & Claude or YouTube Transcript Generator
Explore More Summaries from fxalexg 📚






Summarize YouTube Videos and Get Video Transcripts with 1-Click
Try YouTube Summary with ChatGPT & Claude or YouTube Transcript Generator