How Does ICT Analyze the NASDAQ Morning Session? | 2024 Mentorship Lecture #9, August 15, 2024
TL;DR
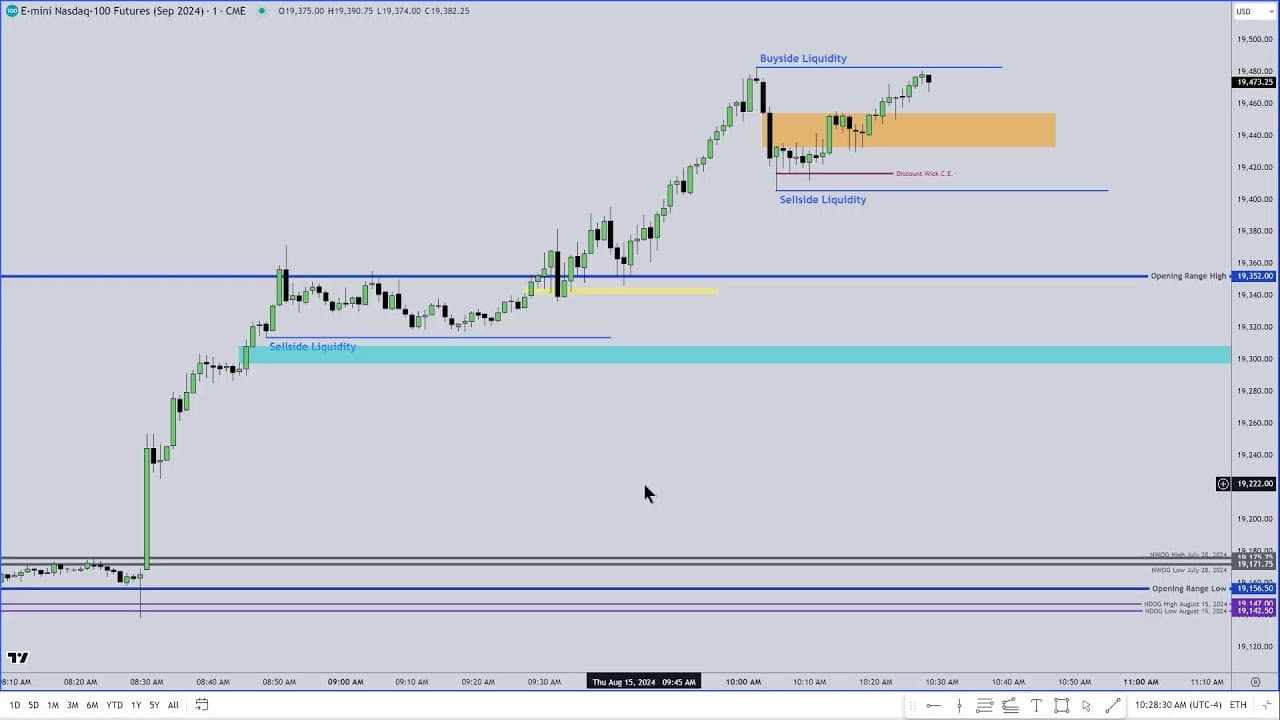
Analyze the NASDAQ morning session by marking the 9:30 a.m. opening price, observing the opening range from 9:30 to 10:00 a.m. New York time, and tracking gaps and liquidity. In this session, ICT studies a large premium opening, an initial run toward buy-side liquidity, and a possible inversion fair value gap rather than chasing the rally. Read on for the specific chart setup and entry logic.
Transcript
e e e my I lovely lady LS yeah what's up good morning good morning it's a good morning it is a good morning this OBS was uh sparring with me again before I can get the stream started but that's okay it's a little bit faster uh resolution for it this morning hope you're doing well this obviously we are in the Thursday trading session for uh indices ... Read More
Key Insights
- The opening range is the first 30 minutes of trading from 9:30 to 10:00 a.m. New York local time.
- A large gap between the previous day's close and the opening price can indicate potential market movement.
- Traders should focus on liquidity gaps and fair value gaps to find entry and exit points.
- Patience is crucial; wait for clear market signals before making trades.
- Election years often see stock markets rise, as they aim to create a positive economic perception.
- Avoid chasing price; instead, look for discounted buying opportunities or premium selling opportunities.
- Securities markets are speculative and not always indicative of the broader economy.
- Simulated trading results may differ significantly from actual trading outcomes due to various market factors.
Install to Summarize YouTube Videos and Get Transcripts
Explore YouTube Video Summarizer or Get YouTube Transcript Extractor
Questions & Answers
Q: How does ICT analyze the NASDAQ morning trading session?
ICT marks the 9:30 a.m. opening price and watches the first 30 minutes, from 9:30 to 10:00 a.m. New York time. He then evaluates the opening gap, buy-side liquidity, fair value gaps, volume imbalances, and the market’s response at those areas.
Q: What is the opening range in ICT trading?
The opening range is the first 30 minutes of trading, from 9:30 to 10:00 a.m. New York local time. ICT says the TradingView platform should be set to New York time so the session timing matches the material taught on the channel.
Q: How does ICT mark the NASDAQ opening price?
ICT identifies the first opening price at 9:30 a.m. and updates the marked level on the chart. In this session, the opening price is stated as 352.
Q: Which chart time frames does ICT use for this NASDAQ analysis?
ICT displays a 15-minute chart in the upper-left corner, a 5-minute chart in the lower-left corner, and a 1-minute chart on the right. He uses the 1-minute chart to examine immediate reactions, gaps, liquidity, and potential entries.
Q: What does a large premium opening mean for ICT’s analysis?
The session opens substantially above where the prior regular trading session settled. ICT says this does not guarantee a complete return to the lower level, so he waits for indications that price may attempt to trade back toward it.
Q: How does ICT use fair value gaps to identify an entry?
ICT highlights a small gap and observes price trading back into it before running toward liquidity. He says the fair value gap or breaker could serve as an entry area, noting that the example had zero heat and moved to liquidity in about 1 minute.
Q: What is an inversion fair value gap in this NASDAQ setup?
ICT watches the yellow gap to see whether price can break below it and then return upward to treat it as an inversion fair value gap. He expects that pattern, if it appears, to send price toward the liquidity and another gap below.
Q: Why does ICT avoid buying after the initial rally?
ICT considers the morning price too rich and expensive after a gap-higher opening and an initial run to buy-side liquidity. Rather than chasing the move, he waits to see whether price breaks below the highlighted gap and offers a clearer setup.
Summary & Key Takeaways
-
The opening range sets the tone for the trading day, with the first 30 minutes being critical for determining market direction. Traders should watch for liquidity and fair value gaps, as these can indicate potential entry and exit points. Patience is essential, as premature trades can lead to losses.
-
Election years often see a rise in stock markets, driven by the desire to create a positive economic perception. Traders should avoid chasing price movements and instead focus on buying at discounts or selling at premiums. Understanding market behavior and waiting for clear signals can prevent unnecessary risks.
-
Simulated trading results have limitations and may not reflect actual outcomes due to factors like liquidity and financial risk. Traders should be aware of these limitations and consider them when analyzing hypothetical performance results. It's important to trade with caution and not risk more than one can afford to lose.
Read in Other Languages (beta)
Share This Summary 📚
Summarize YouTube Videos and Get Video Transcripts with 1-Click
Try YouTube Summary with ChatGPT & Claude or YouTube Transcript Generator
Explore More Summaries from The Inner Circle Trader 📚

Summarize YouTube Videos and Get Video Transcripts with 1-Click
Try YouTube Summary with ChatGPT & Claude or YouTube Transcript Generator