How to Analyze a Nasdaq Futures Intraday Trade
TL;DR
Identify higher-time-frame imbalances first, then refine the setup from the hourly chart through the 15-minute, five-minute, and one-minute charts. On non-farm payroll weeks, the analysis recommends concentrating on Monday through Wednesday before the New York session, because later trading can become choppier and less precise, especially when an FOMC event is scheduled.
Transcript
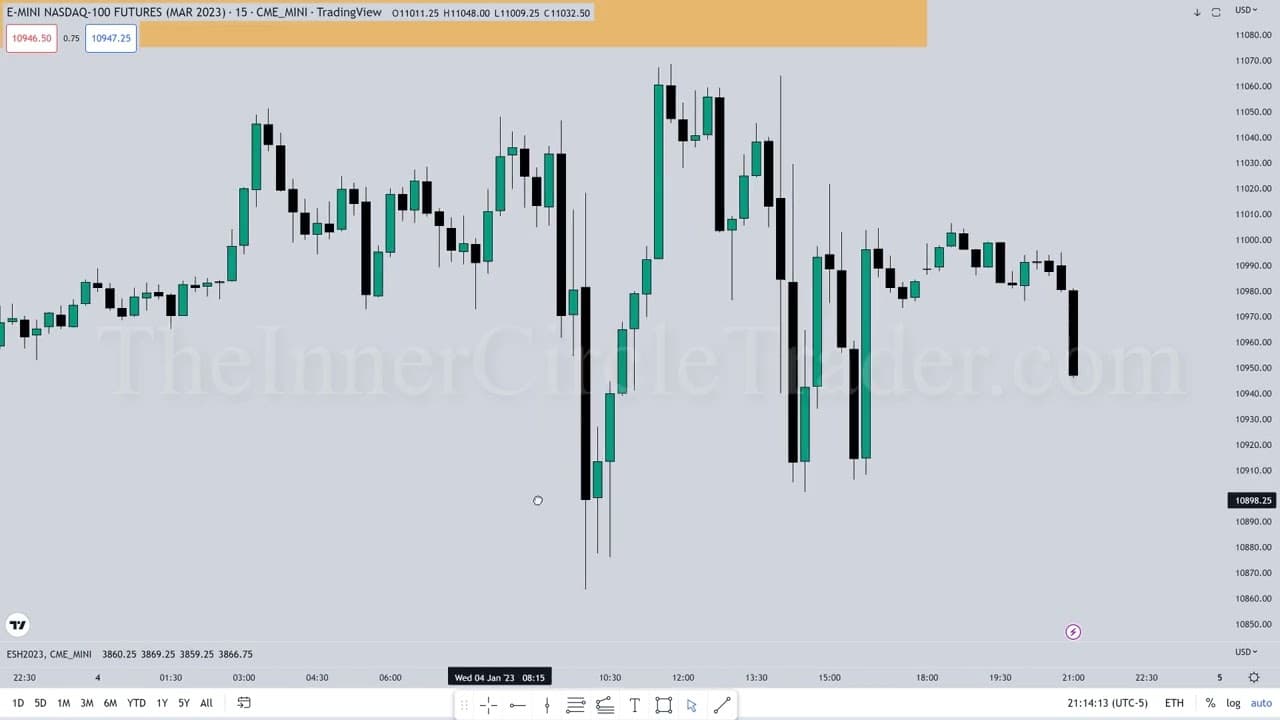
all right folks welcome back we're gonna be looking at the NASDAQ 100 Futures March delivery contract for 2023 is our daily chart and let's go right into the volume and balance right in here and this is a level I had in mind for Wednesday's trading I was expecting it to trade up into that announce the body close to body opening with this single pas... Read More
Key Insights
- A volume imbalance is identified where multiple candle wicks contain price action without candle bodies occupying the same area. The analysis uses the low and high of neighboring wicks to define this higher-time-frame price zone and anticipate that the algorithm may later refer to it.
- The daily-chart objective is a higher-time-frame imbalance above the market. Price did not need to reach that objective for the trade to be profitable, but merely taking relative equal highs was not considered sufficient confirmation that the broader anticipated delivery had completed.
- Non-farm payroll week is treated as a special trading environment. The stated approach is to focus on Monday, Tuesday, and Wednesday up to the New York session because Thursday, Friday, and the period after Wednesday's New York session may become choppier and less precise.
- The January 3 low provides a fractal reference for analyzing the January 4 low. The presenter uses the earlier price action to explain why a long position near the later low could target relative equal highs and potentially continue toward the daily-chart imbalance.
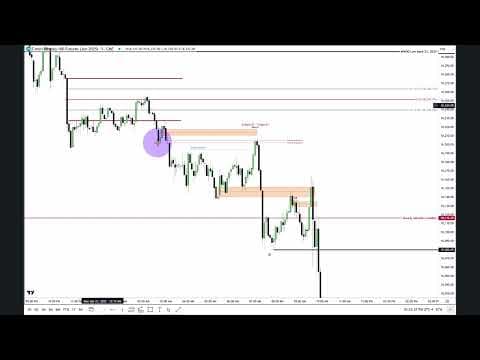
- The setup is refined through multiple time frames. The daily chart establishes the imbalance, the hourly chart provides the broad framework, the 15-minute chart highlights relative equal highs, the five-minute chart isolates the imbalance, and the one-minute chart supports execution analysis.
- The price level 10,864.75 is anchored to the high of a down-close five-minute candle followed by upward price movement. The presenter describes this structure as a buy-side imbalance of efficiency and uses it as an initial area of interest near the January 4 low.
- The Nasdaq futures concepts are presented as applicable to US 100 pricing for traders outside the United States. The transcript cautions that US 100 will not mark to market perfectly against the NQ futures contract, although its movement is described as close enough for applying the demonstrated concepts.
- The one-minute chart still requires patience because every candle must close before the next candle begins. A faster chart does not eliminate the passage of time, and holding a position through one-minute price development can remain demanding despite the chart's apparent speed.
Install to Summarize YouTube Videos and Get Transcripts
Explore YouTube Video Summarizer or Get YouTube Transcript Extractor
Questions & Answers
Q: How do you identify a volume imbalance on a futures chart?
A volume imbalance is identified by examining an area where candle wicks contain price action but candle bodies do not. In the example, the analyst compares one candle's low wick with neighboring high wicks and observes that the enclosed region was traversed only by wicks. That structure draws attention as a price area the algorithm may reference later.
Q: How should Nasdaq futures analysis move across time frames?
Begin with the daily chart to locate a higher-time-frame imbalance and the broader intended objective. Move to the hourly chart to establish the framework around the important low, relative equal highs, and net volume. Then use the 15-minute and five-minute charts to refine the imbalance before examining one-minute price action for the detailed trade execution and replay.
Q: Why focus on Monday through Wednesday during non-farm payroll week?
The stated trading approach limits attention to Monday, Tuesday, and Wednesday up to the New York session during non-farm payroll week. Employment numbers arrive on Thursday and Friday of that week, and price action during those days can become choppier and less precise. Similar deterioration may occur after the New York session on Wednesday, making later setups less dependable.
Q: Why was the January 4 Nasdaq low considered a long opportunity?
The January 4 low aligned closely with a five-minute reference derived from January 3 price action. The high of a down-close candle followed by upward movement established a buy-side imbalance of efficiency near 10,864.75. That reference created initial interest in the low, with relative equal highs and a higher-time-frame imbalance serving as possible upside objectives.
Q: What were the upside targets for the Nasdaq futures trade?
The first visible objective was a group of relative equal highs on the lower-time-frame chart. Beyond those highs, the analyst was seeking delivery into a daily-chart imbalance defined by wick-only price action. Price took the relative equal highs but did not touch the higher imbalance, which was acceptable for profitability even though it did not fully satisfy the broader expectation.
Q: How did FOMC affect the January 4 trading conditions?
An FOMC event was scheduled for two o'clock, and the session showed repeated back-and-forth movement before that event. The analyst presented this behavior as an example of why non-farm payroll weeks can be less precise later in the week. The trade review was intended to expose those conditions, not to encourage trading every Wednesday, Thursday, or Friday of such weeks.
Q: Can traders outside the United States apply this analysis?
The transcript says traders outside the United States may examine US 100 through brokers that provide it when they cannot trade the American Nasdaq futures contract. US 100 is described as an equivalent that will not mark to market perfectly against NQH2023, but its pricing is considered close enough for applying the concepts demonstrated in the Nasdaq futures analysis.
Q: Why does one-minute chart trading still require patience?
A one-minute chart may look fast, but each individual candle still has to form and close before another candle begins. The analyst emphasizes that time must be paid with patience, particularly when holding through a live sequence. A compressed replay can make execution appear easier than it felt while the original price action unfolded candle by candle.
Summary & Key Takeaways
-
The analysis begins on the daily Nasdaq 100 March 2023 futures chart, where wick-defined price action identifies a volume imbalance. That higher-time-frame area provides the intended objective, while the low from January 3, relative equal highs, and net volume establish the framework for examining the January 4 trade.
-
The setup is refined sequentially through hourly, 15-minute, five-minute, and one-minute charts. A down-close candle and subsequent upward movement identify a buy-side imbalance of efficiency near 10,864.75. That reference supports interest in the low and a possible move toward relative equal highs or the higher imbalance.
-
The session occurred during non-farm payroll week with an FOMC event scheduled for two o'clock. The presenter says these conditions can produce choppy, less precise price action and normally favors trading Monday through Wednesday before the New York session. The review demonstrates analysis rather than encouraging trading during those conditions.
Read in Other Languages (beta)
Share This Summary 📚
Summarize YouTube Videos and Get Video Transcripts with 1-Click
Try YouTube Summary with ChatGPT & Claude or YouTube Transcript Generator
Explore More Summaries from The Inner Circle Trader 📚
Summarize YouTube Videos and Get Video Transcripts with 1-Click
Try YouTube Summary with ChatGPT & Claude or YouTube Transcript Generator