How Do Trading Strategies Work? Every Single Strategy Explained for Beginners
TL;DR
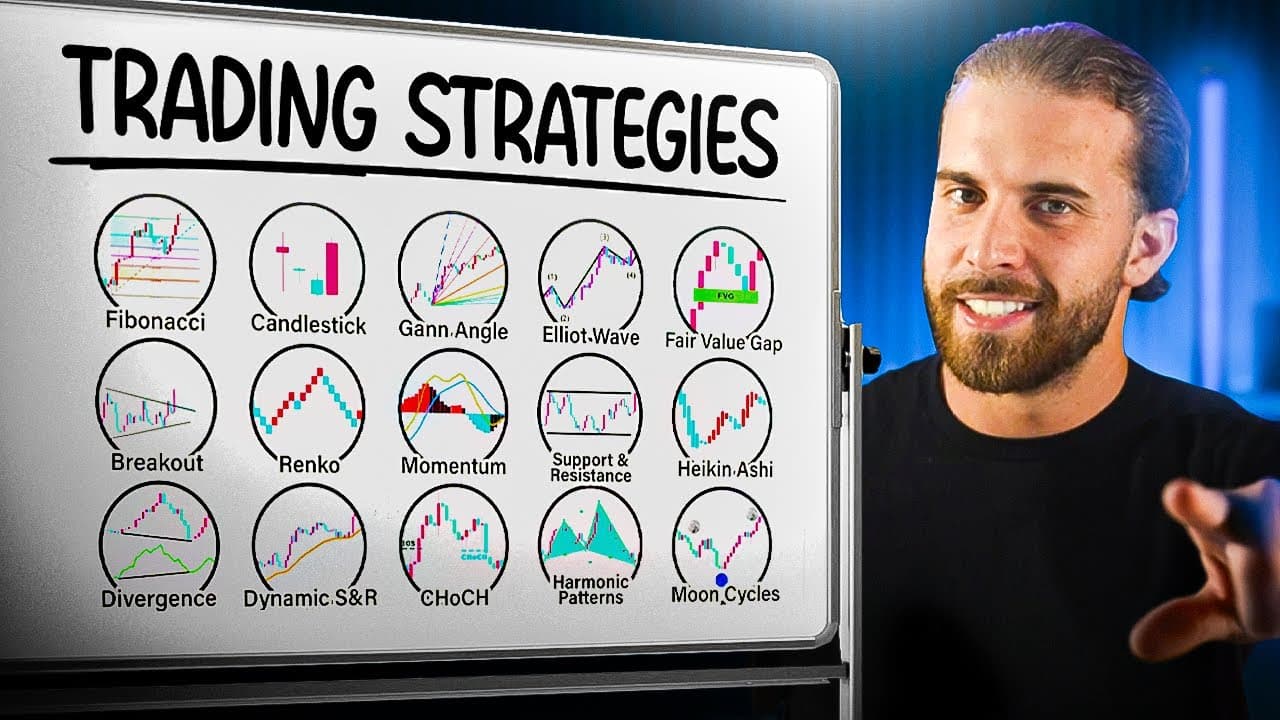
The best trading strategy is one you understand and can apply consistently, not a single method that beats every alternative. The guide explains tools and concepts including Fibonacci retracement, candlestick patterns, head and shoulders, top-down analysis, break of structure, breakouts and retests, support and resistance, and EMAs. Read on to compare how these approaches help traders decide when to buy or sell.
Transcript
There's endless trading strategies for you to make money out there. And there's a lot of people asking me if my strategy is the best one in the world. Is my strategy engulf every other strategy out there that exists? And as much I'd want to say yes, the answer is no. I only use a strategy and the concepts that I understand for myself and give me re... Read More
Key Insights
- Fibonacci retracement is used to predict potential reversal levels in a trend.
- Candlestick patterns indicate market sentiment and potential reversals.
- The head and shoulders pattern is a reliable reversal indicator.
- Top-down analysis helps determine market trends by evaluating multiple time frames.
- Break of structure indicates a shift in market trend, useful for identifying reversals.
- Breakouts and retests are strategies for entering trades after consolidation.
- Support and resistance levels are critical for identifying potential entry and exit points.
- Indicators like EMAs provide additional confluence but should not be relied upon solely.
Install to Summarize YouTube Videos and Get Transcripts
Explore YouTube Video Summarizer or Get YouTube Transcript Extractor
Questions & Answers
Q: How do beginners choose a trading strategy?
Choose a strategy whose concepts make sense to you and that you can apply consistently. The speaker says no strategy is the best in the world and notes that successful traders can use very different concepts.
Q: How do you use Fibonacci retracement in trading?
Place the Fibonacci tool from the bottom of a rising structure, or higher low, to the higher high. Traders then watch the 38.2%, 50%, 61.8%, and 78.6% retracement areas for a potential end to the pullback and an opportunity to trade with the trend.
Q: What do the main Fibonacci retracement levels mean?
The 38.2% level represents a quick retracement when the market is trending rapidly, while 50% marks a halfway retracement. The deeper 61.8% and 78.6% levels are described as the Fibonacci golden zone.
Q: What are candlestick reversal patterns?
Candlestick reversal patterns are chart formations that indicate a possible change in market direction. Examples include hammer, shooting star, and engulfing patterns, and they are most effective around support or resistance with confirmation from other tools.
Q: Why is the head and shoulders pattern significant?
Head and shoulders is a reversal pattern that can signal a change in trend direction. It becomes more reliable when price breaks the neckline and subsequently retests it.
Q: What is top-down analysis in trading?
Top-down analysis evaluates multiple time frames to establish the broader market trend and refine a trade. Traders examine higher time frames such as weekly or daily charts before using lower time frames such as the 4-hour or 1-hour chart for more precise entries and exits.
Q: What is the breakout and retest strategy?
This strategy waits for price to break beyond a consolidation zone and then return to test the breakout level. Traders seek a candlestick close beyond the zone as confirmation and use the retest as a potential entry.
Q: What role do support, resistance, and EMAs play in trading?
Support and resistance identify areas where price has historically struggled to move lower or higher, helping traders consider entries and exits. EMAs can add confirmation about trends or reversals, but because they lag price, they should be combined with price action and other analysis rather than used alone.
Summary & Key Takeaways
-
Fibonacci retracement helps traders identify potential reversal points by measuring the extent of a market move. Key levels include 38.2%, 50%, and 61.8%, which are often used to determine entry points.
-
Candlestick reversal patterns, such as the hammer and engulfing patterns, provide insights into market sentiment and potential turning points. These patterns are most effective when used in conjunction with other indicators.
-
The head and shoulders pattern is a classic reversal pattern that signals a change in trend direction. It is most reliable when confirmed by a break of the neckline and a subsequent retest.
Read in Other Languages (beta)
Share This Summary 📚
Summarize YouTube Videos and Get Video Transcripts with 1-Click
Try YouTube Summary with ChatGPT & Claude or YouTube Transcript Generator
Explore More Summaries from fxalexg 📚





Summarize YouTube Videos and Get Video Transcripts with 1-Click
Try YouTube Summary with ChatGPT & Claude or YouTube Transcript Generator