How to Trade Price Action on Slow Economic Calendar Days
TL;DR
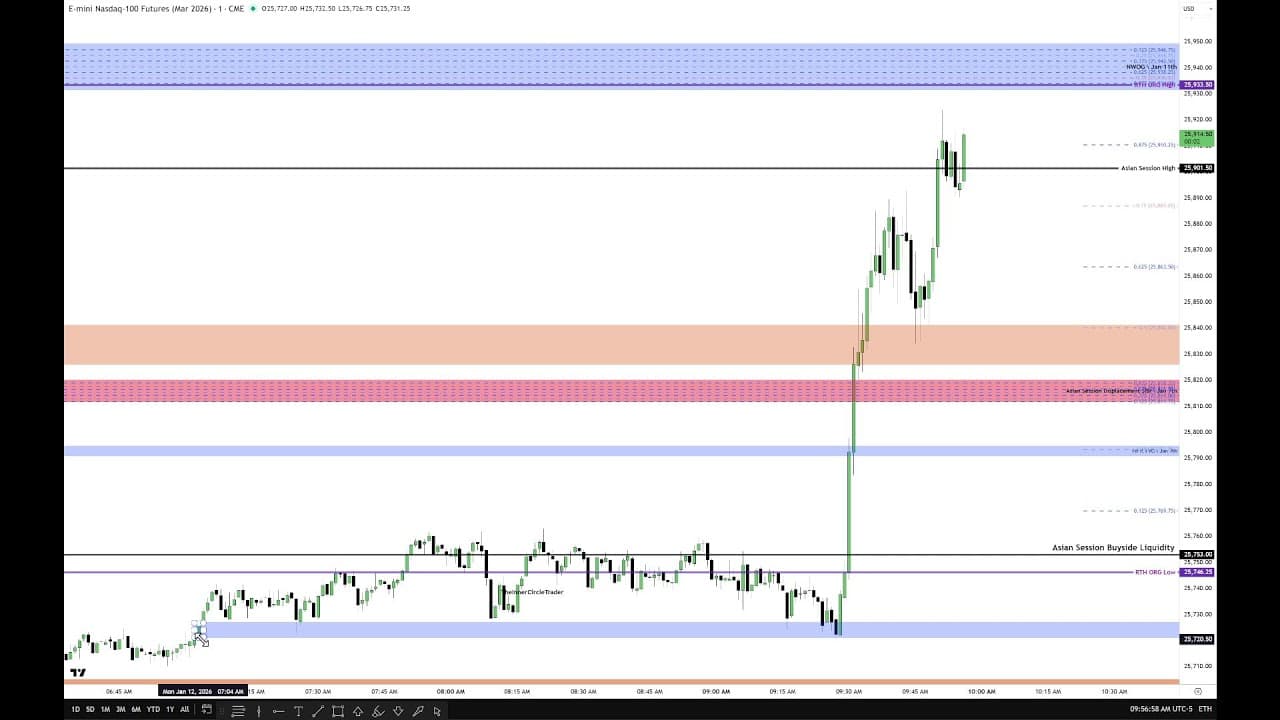
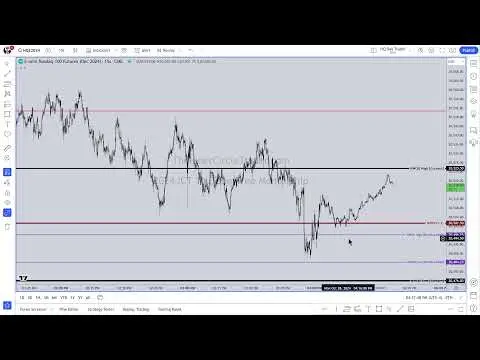
On a Monday with no significant news drivers, focus purely on price action by defining predetermined points of interest (PD arrays) that are salient because of liquidity or inefficiency. The highest-probability setups form within the last 20 trading days, and combining these levels with time is the core of price delivery. High-impact reports like CPI and PPI later in the week make those days nearly impossible to trade without gambling.
Transcript
Good morning, folks. How are you? Happy Monday morning. Hope you had a pleasant weekend. Could you guys give me a heads up on X? Let me know you can hear me. hear me. Just heard my own audio check. Awesome. Thank you for that. Thank you so much. All right. So, uh, just want to talk a little bit this morning. I'm not going to go all the way to the o... Read More
Key Insights
- Points of interest, called PD arrays, are levels that matter because of liquidity, imbalance, or inefficiency; combining one of those with time is the only thing that drives price delivery outside of manual or geopolitical intervention.
- The highest-probability, precision, high-frequency setups form within the last 20 trading days, not calendar days, because those PD arrays are the crispest, most salient, and most respected reference points.
- A look-back framework of 20, 40, and 60 trading days is used to grade price action, with the most recent 20-day window carrying the greatest weight for high-precision setups.
- Opening gaps stay important for at least five days whether they fill in or remain open, which contradicts the industry view that a gap is 'one and done' and discarded once price trades back into it.
- Engineered liquidity is where the market runs to an obvious level that looks like a textbook support or resistance zone; 'obvious' is synonymous with retail, and those smooth levels become targets rather than trade entries.
- Smooth highs and smooth lows during a session tend to become jagged, so ICT looks for these single or smooth highs and lows in past price action rather than trading them as they form in real time.
- Ranges are graded using eighths and quadrants (high, upper quadrant, mid-range, lower quadrant, low) to remove ambiguity and give specific levels, avoiding guesswork over which lows to connect for diagonal trend lines.
- High-impact reports create untradeable conditions: Tuesday brings CPI, Wednesday brings PPI and retail sales, and Thursday brings the Philly Fed manufacturing index and employment claims, which he calls 'face rippers.'
Install to Summarize YouTube Videos and Get Transcripts
Explore YouTube Video Summarizer or Get YouTube Transcript Extractor
Questions & Answers
Q: How do you trade a day with no economic news drivers?
When the economic calendar is anemic with no medium or high-impact drivers, you are forced to look at pure price action. The approach is to define price using predetermined PD arrays or points of interest that are salient because of liquidity, imbalance, or inefficiency. You incorporate time in association with one of these, since combining time with a level is the only thing that drives price delivery outside of manual or geopolitical intervention.
Q: What is a PD array in ICT price action?
A PD array, or point of interest, is a level on the chart that is salient because of liquidity and/or imbalance or inefficiency. These serve as points of reference that traders use to apply buying and selling pressure. Examples include opening gaps and fair value gaps. When time is incorporated in association with a PD array, that combination is what enables price delivery under normal, non-disrupted market conditions.
Q: Why does ICT focus on the last 20 trading days?
Using a frame of reference with look-back periods of 20, 40, and 60 days, the highest-probability, precision, high-frequency setups form in the last 20 days. Looking back over the last 20 trading days, not calendar days, shows the crispest, most precise, most salient, and most respected PD arrays. These recent levels fall within his range of interest because they are the most responsive.
Q: How long do opening gaps stay relevant?
Opening gaps stay important for at least five days, whether they fill in or remain open. This contradicts the common industry view that a gap is 'one and done' and becomes trash once it closes or price trades back into it. Even after price overlaps or trades through them and moves the other direction, gaps remain useful points of reference. Types include weekly, new week, new day, and regular trading hours opening range gaps.
Q: What is engineered liquidity?
Engineered liquidity is where the market runs to an obvious level. 'Obvious' is synonymous with retail, meaning a level that looks like the perfect textbook scenario of resistance or support, drawn as repeated equal highs or lows that every textbook labels a strong resistance level. Rather than trading these as they form, ICT treats them as targets, because you cannot know if new traders will run through the level or if price will continue in the other direction.
Q: Why are smooth highs and lows important in price action?
The primary function is to look for times in the chart where smooth highs, smooth lows, or single highs and single lows exist. Smooth areas in price action tend to become jagged, meaning price tends to return and disrupt them. ICT looks for these smooth highs and lows in past price action rather than trading them as they form, because framing them on the basis of time reveals the trap and provides a draw on liquidity.
Q: How does ICT grade a price range using quadrants?
A range is divided into mid-range, upper quadrant, lower quadrant, and the high and low of the range, based on quarters (not quarterly theory). Grading can also be done on the eighths. This removes ambiguity by giving very specific levels, so you do not have to guess which low to use to draw a diagonal support or resistance trend line. Diagonal trend lines are used only for targeting, especially when clean and opposed to the expected direction.
Q: What is the Asian session buyside liquidity level?
The Asian session buyside liquidity refers to smooth highs formed during the Asian session, with one example high forming at 10:00 in the evening during Sunday's Asian session. That timing is outside the Asian session kill zone, described as a roughly two-hour evening window that is the sweet spot for scalping. The Asian session ends and closes around 5:00 a.m. Eastern time, and traders visually mark that range to find obvious smooth highs or lows as a draw on liquidity.
Summary & Key Takeaways
-
The session opens by reviewing the economic calendar, noting Monday has no significant news drivers while Tuesday brings CPI, Wednesday PPI and retail sales, and Thursday the Philly Fed manufacturing index and employment claims, making those days nearly impossible to trade without gambling.
-
On quiet days, price must be defined using predetermined PD arrays or points of interest that are salient because of liquidity, imbalance, or inefficiency. Combining these levels with time is the only mechanism of price delivery outside of manual or geopolitical disruption of market sentiment.
-
Practical tools include grading opening gaps for at least five days, using a 20/40/60-day look-back with the last 20 trading days weighted most, marking Asian session buyside liquidity, recognizing engineered liquidity at obvious retail levels, and expecting smooth highs and lows to become jagged.
Read in Other Languages (beta)
Share This Summary 📚
Summarize YouTube Videos and Get Video Transcripts with 1-Click
Try YouTube Summary with ChatGPT & Claude or YouTube Transcript Generator
Explore More Summaries from The Inner Circle Trader 📚


Summarize YouTube Videos and Get Video Transcripts with 1-Click
Try YouTube Summary with ChatGPT & Claude or YouTube Transcript Generator