How to Use thinkorswim's MarketWatch Tab Effectively
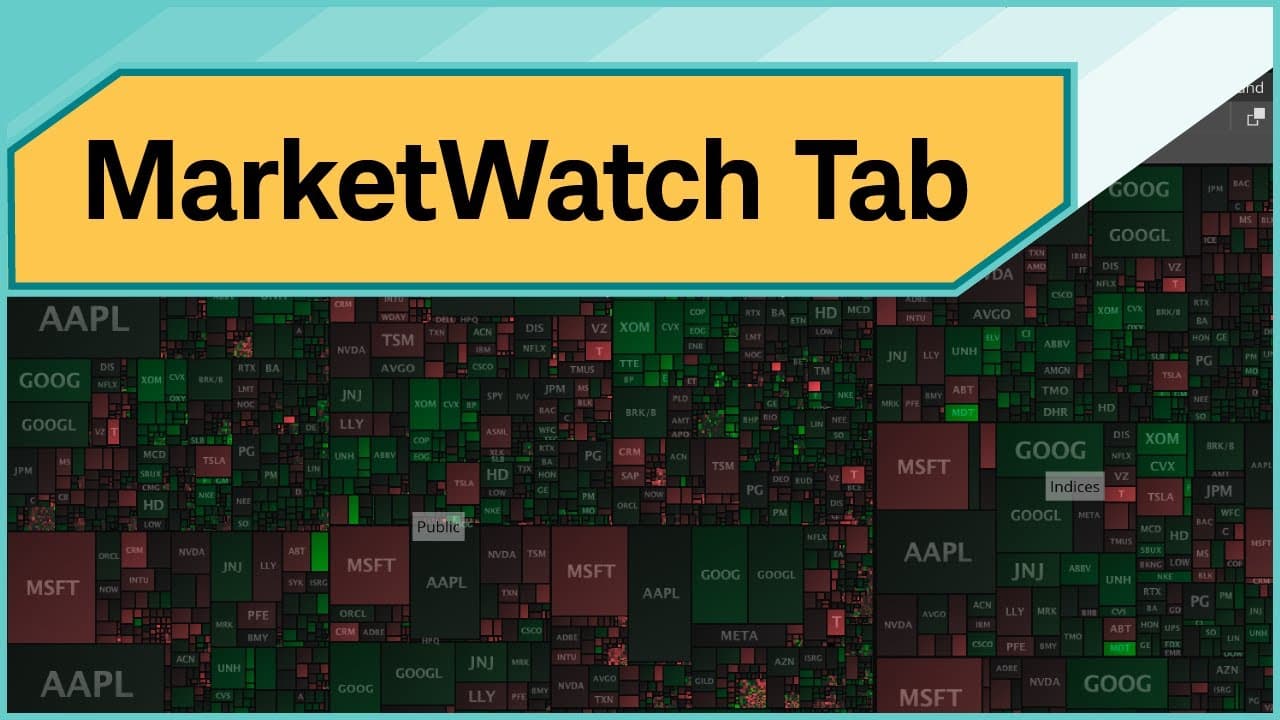
TL;DR
The thinkorswim MarketWatch tab allows users to create personalized watchlists, set alerts for specific stocks, visualize market data, access forex financing rates, and track important economic events. To create a watchlist, simply add stock symbols and save it. Alerts can be set for price changes to stay informed about significant market movements.
Transcript
The MarketWatch tab helps you monitor important developments in the markets by providing important data and helping you process it. So, starting here from the home screen, we're going to navigate straight to the MarketWatch tab. And we're immediately presented with five subtabs. We have Quotes. And Quotes allows you to create watchlists of indices,... Read More
Key Insights
- 👤 The MarketWatch tab on thinkorswim is a powerful tool that helps users monitor market developments.
- 👻 Creating watchlists allows users to stay on top of important changes in metrics for various assets.
- 😫 Setting up alerts for specific stocks helps users stay informed about significant events and price movements.
- 🦻 The Visualize tab provides visual representations of market data, aiding in trend analysis and decision-making.
- ☠️ The Financing Rates subtab is beneficial for forex traders, providing essential rates information for informed trading.
- 🤙 The Calendar subtab keeps users updated on earnings, conference calls, economic events, and other important events.
Install to Summarize YouTube Videos and Get Transcripts
Explore YouTube Video Summarizer or Get YouTube Transcript Extractor
Questions & Answers
Q: How can I create a watchlist on the MarketWatch tab?
To create a watchlist on thinkorswim's MarketWatch tab, go to the Quotes subtab, click on the menu below the tab, and select "Create watchlist." Give it a name and add symbols of the stocks, ETFs, or other assets you want to monitor.
Q: How can I set up alerts for specific stocks?
To set up alerts for specific stocks on the MarketWatch tab, navigate to the Alerts subtab and select an example stock. Choose a condition, such as when the last price is at or below a certain value, and create the alert. You can customize where the alerts are sent in the Application Settings.
Q: What does the Visualize tab provide?
The Visualize tab within the MarketWatch tab offers a visual representation of market data. It includes charts, graphs, and other visual tools to help users analyze and understand market trends and patterns.
Q: What information does the Financing Rates subtab provide?
The Financing Rates subtab on the MarketWatch tab is particularly useful for forex traders. It provides essential rates information related to Forex trading, enabling traders to stay informed about borrowing and lending rates.
Summary & Key Takeaways
-
The MarketWatch tab on thinkorswim offers five subtabs: Quotes, Alerts, Visualize, Financing Rates, and Calendar.
-
Users can create watchlists of stocks, ETFs, futures, and more to monitor important changes in metrics.
-
The Alerts tab allows users to set notifications for specific market conditions, and the Visualize tab provides visual representations of market data.
-
The Financing Rates subtab offers crucial rates information for forex traders, and the Calendar highlights earnings, conference calls, economic events, dividends, and splits.
Read in Other Languages (beta)
Share This Summary 📚
Summarize YouTube Videos and Get Video Transcripts with 1-Click
Try YouTube Summary with ChatGPT & Claude or YouTube Transcript Generator
Explore More Summaries from Charles Schwab 📚





Summarize YouTube Videos and Get Video Transcripts with 1-Click
Try YouTube Summary with ChatGPT & Claude or YouTube Transcript Generator