How the ICT Price Action Model 9 One Shot One Kill Trade Plan Works
TL;DR
The one shot one kill model targets an easy 50 to 75 pips per week by mapping the last 20 weeks' highest high and lowest low as the dealing range, then trading toward a liquidity draw in the direction of the weekly bias during London or New York kill zones, timed to high-impact news that injects volatility.
Transcript
okay folks welcome back this is the IC intership 50 to 75 Pips per week model price action model number nine one shot one kill I appreciate your patience I was trying to get a setup for this model on the Monday week ending December 4th 2020 but it required me to get it on Tuesday so uh we're looking at a example inside of this trade plan I usually ... Read More
Key Insights
- The one shot one kill model targets 50 to 75 pips per week, but the preference is an easy 50 pips (half a penny move) rather than forcing the full 75-pip maximum entry to exit.
- The preparation stage replaces days with weeks: note the highest high and lowest low of the past 20 weeks, which becomes the current dealing range on an intermediate-term time horizon for more predictive institutional draw levels.
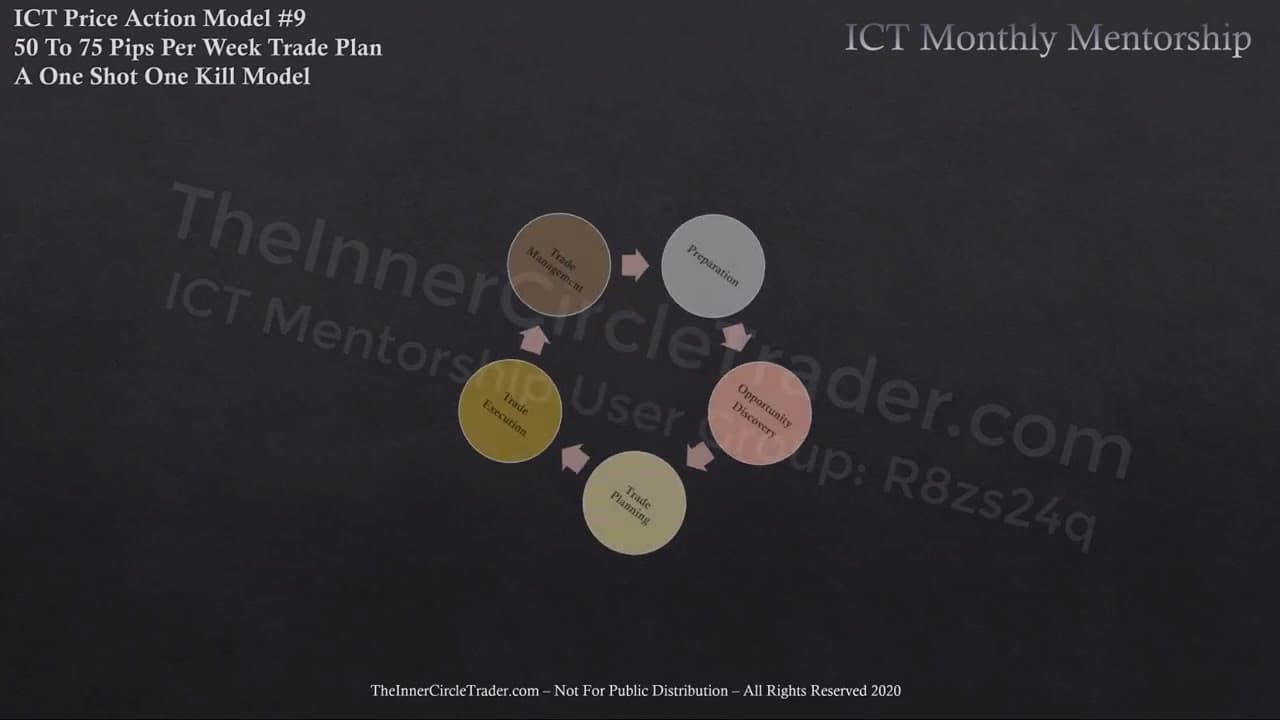
- Every trade plan follows five stages: preparation, opportunity discovery, trade planning, trade execution, and trade management.
- Entries use a 15-minute chart optimal trade entry inside a retracement during London open or New York open kill zones, timed to an economic calendar event that suggests a volatility injection.
- Trade management takes 50 pips as the objective, then closes 80% of the position and lets the remainder attempt to reach 75 pips, taking partials at logical short-term highs or lows.
- Stop-loss reduction is staged: at 50% of the expected objective in profit, cut the stop by 25%; at 75% in profit, reduce it to breakeven.
- Position size equals account equity times risk percent divided by stop-loss in pips; a $10,000 account risking 1% ($100) with a 20-pip stop allows 50 micro lots or five mini lots per trade.
- Equity leveling rules smooth the curve: after a full-R loss cut risk 50% until half is recovered, and after five winning trades in a row drop risk 50% to reduce the likelihood of a large drawdown.
Install to Summarize YouTube Videos and Get Transcripts
Explore YouTube Video Summarizer or Get YouTube Transcript Extractor
Questions & Answers
Q: What is the ICT one shot one kill trade plan?
The one shot one kill trade plan is ICT price action model number nine, designed to capture 50 to 75 pips per week. It follows five stages: preparation, opportunity discovery, trade planning, trade execution, and trade management. The preference is an easy 50 pips, described as roughly a half-penny move, rather than forcing the full 75-pip maximum from entry to exit, though a trader can graduate to targeting 75 pips as their model.
Q: How do you set the dealing range in this model?
In the preparation stage you use the weekly chart instead of the daily, replacing days with weeks. You note the highest high and the lowest low of the past 20 weeks, and that range becomes your current dealing range. This intermediate-term time horizon gives more predictive nature to where price will draw on an institutional level, not intraday but on a larger macro scale. Inside this range you look for the next draw in liquidity below an old low or above an old high.
Q: When should you enter a trade using this model?
Entries are anticipated on a 15-minute chart optimal trade entry that forms inside a retracement during the London open and/or New York open kill zones. When bearish you look for a retracement higher or a buy stop raid to go short; when bullish you look for a retracement lower or a sell stop raid to go long. The entry is timed to a day and news release on the economic calendar where a volatility injection would likely unfold, creating a low resistance liquidity run condition.
Q: How do you manage the trade and take profit?
You place a limit order to take 50 pips as the objective on a single position. Alternatively, you can use one order to manage the trade idea: once you capture the 50-pip objective, close 80% of the position and see if the remainder can reach 75 pips, taking partials along the way at logical short-term highs when long or short-term lows when short. This lets you secure the base target while allowing the runner to extend toward the upper end of the range.
Q: How does stop-loss management work in the one shot one kill model?
Stop-loss reduction is staged based on profit relative to your expected objective. When you are in profit by 50% of the expected objective, the stop loss can be reduced by 25%. When you are in profit by 75% of the expected objective, the stop loss can be reduced to breakeven. This progressive tightening protects gains as the trade moves in your favor, and the technique is demonstrated in the real execution example on the presenter's YouTube channel.
Q: How do you calculate position size for this model?
Position size equals account equity times risk percent, divided by the stop loss in pips. For a $10,000 account risking 1%, that is $100 of risk. With a 20-pip stop using micro lots (1K leverage at 10 cents per pip), 10 cents times 20 pips is $2 per pip, and $100 divided by $2 allows 50 micro lots. Using mini lots (10K at $1 per pip), a 20-pip stop costs $20, so $100 divided by $20 allows five mini lots. Always round down and never use a standard lot because it is too much leverage.
Q: What are the equity-leveling risk rules after wins and losses?
If your demo account takes a full-R loss, drop the risk percent by 50% on the next trades; once the loss is recovered by 50%, you can return to maximum risk per trade. For example, after a full $100 loss you risk only $50, and making $25 back lets you return to the $100 risk. Additionally, if you take five winning trades in a row, drop your risk percent by 50% because a loss is likely to follow eventually. These rules build equity leveling and reduce the likelihood of a large drawdown, producing a smoother equity curve.
Q: What was the real euro dollar example used for this model?
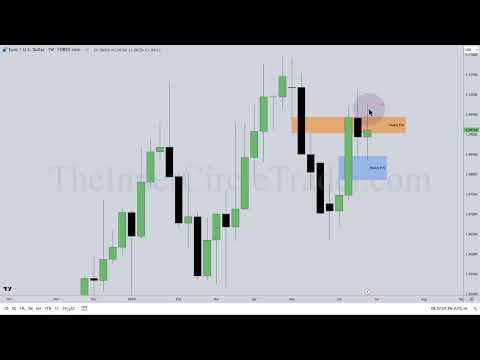
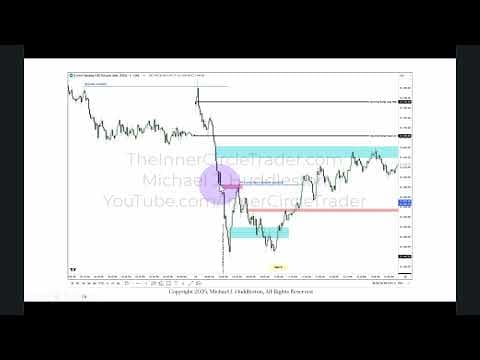
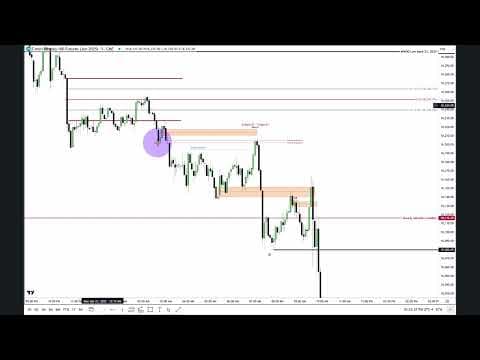
The example covered the week ending December 4th 2020, where commentary was bullish euro dollar and bearish dollar, anticipating price reaching a fair value gap on higher time frame charts. On the weekly chart a fair value gap and the 20-week old high were referenced, with a run above that old high expected for buy-side liquidity. On Tuesday December 1st 2020, the economic calendar showed a high-impact event with the FED chair speaking at 10:00 a.m. New York time; the market made an impulse higher, retraced to form an optimal trade entry into the New York session, and a Fibonacci laid over the candle bodies projected the 50-pip target.
Summary & Key Takeaways
-
Price action model number nine, the one shot one kill trade plan, aims for 50 to 75 pips per week. Preparation uses the weekly chart, marking the highest high and lowest low of the last 20 weeks as the dealing range, then identifying where price will draw next in the direction of the weekly bias.
-
Trades are executed during London or New York open kill zones using a 15-minute optimal trade entry inside a retracement, timed to a high-impact economic calendar event that injects volatility. The plan targets a PD array convergence, going long from discount sell-side liquidity when bullish or short from premium buy-side liquidity when bearish.
-
Money management divides account equity times risk percent by stop-loss in pips, always rounding down and never using a standard lot. Equity-leveling rules cut risk after losses or five consecutive wins. A real December 2020 euro dollar example showed a bullish run above the 20-week old high around a FED chair speech.
Read in Other Languages (beta)
Share This Summary 📚
Summarize YouTube Videos and Get Video Transcripts with 1-Click
Try YouTube Summary with ChatGPT & Claude or YouTube Transcript Generator
Explore More Summaries from The Inner Circle Trader 📚
Summarize YouTube Videos and Get Video Transcripts with 1-Click
Try YouTube Summary with ChatGPT & Claude or YouTube Transcript Generator