How to Master Market Structure Trading
TL;DR
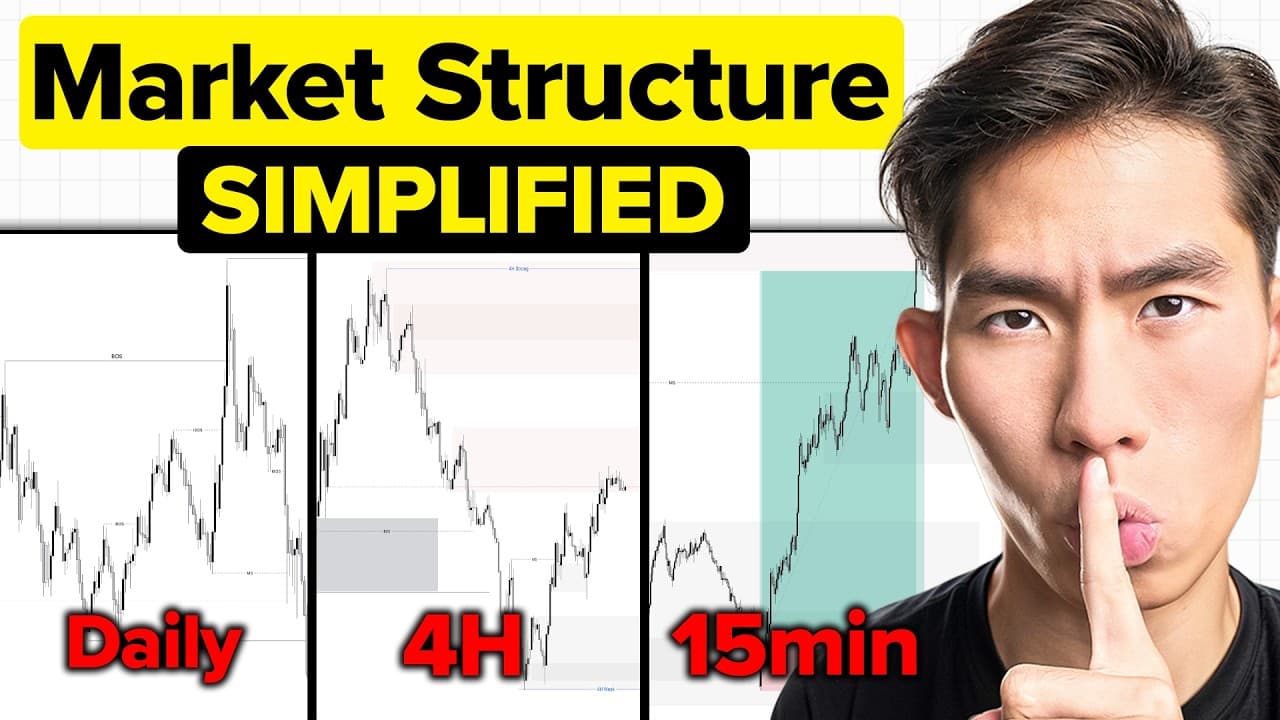
Master market structure trading by mapping price from the daily chart down to the 4-hour or 1-hour chart, defining the active swing range, and waiting for follow-through before choosing longs or shorts. In the session, the analyzed range runs from 1.208208 to 1.14, while an internal bearish shift initially signals a pullback rather than a confirmed reversal. Read on to see how swing structure, liquidity sweeps, and confirmation shape the trade bias.
Transcript
So, you're about to watch a live trading session that I did with my students yesterday inside the 1% club. It's raw. It's unfiltered. You're going to see exactly how I map out my market structure from the higher time frame down to the lower time frame. How I built my bias from A to Z and how I think through the market in real time. And by the way, ... Read More
Key Insights
- Market structure is mapped from higher to lower time frames to identify overall trend direction.
- The market can move in three ways: up, down, or sideways.
- Mapping market structure helps define the trading range and focus areas.
- Internal structure shifts indicate potential short-term market direction changes.
- Price cannot move in one direction indefinitely; pullbacks are natural.
- A market shift on the internal structure suggests a temporary pullback, not a reversal.
- Liquidity sweeps can mislead traders into thinking a reversal has occurred.
- Patience is crucial; wait for the market to reveal its direction before entering trades.
Install to Summarize YouTube Videos and Get Transcripts
Explore YouTube Video Summarizer or Get YouTube Transcript Extractor
Questions & Answers
Q: How do you trade market structure effectively?
Start on the daily time frame and map the swing structure before moving down to the 4-hour or 1-hour chart. Identify the overall direction, define the active swing range, and inspect the internal structure for shifts. Only form a long or short bias after price provides clear follow-through.
Q: How do you identify an uptrend using market structure?
Look for a sequence of higher highs and higher lows, along with bullish breaks of structure. In the session, the most recent break identifies the daily swing low that produced it. During an uptrend, the speaker treats that swing low as strong and the high as weak.
Q: Why should traders define the current swing range?
The swing range identifies where to focus time, energy, and attention. In the example, the relevant range extends from 1.208208 down to 1.14. Price activity outside that range is treated as a distraction.
Q: What is internal market structure?
Internal structure includes the price movements between the current swing high and swing low. These can contain smaller higher highs, higher lows, and internal breaks of structure. Mapping them one layer down helps reveal short-term changes within the broader swing trend.
Q: Does a bearish internal market shift confirm a full reversal?
No. A bearish shift in internal structure can simply facilitate a pullback while the higher-time-frame structure remains bullish. The session treats a possible return toward fair value and the formation of a new higher low as a hypothesis, not a certainty.
Q: How can you distinguish a liquidity sweep from a bearish market shift?
Wait for the next candles and evaluate the follow-through. A V-shaped reaction back upward indicates a liquidity sweep, while a pullback followed by continued downside and a bearish break of structure validates the reversal scenario. A candle body closing below the previous swing low mechanically counts as a market shift, but the speaker still waits for confirmation.
Q: When should you look for shorts or longs after a possible reversal?
Look for shorts if price creates an internal break of structure to the downside and confirms that the swing structure has turned bearish. Look for longs if the move below the strong low proves to be a liquidity sweep and internal structure shifts from bearish back to bullish. Until either scenario develops, stay out of the market.
Q: Which time frames are used to map market structure?
The process begins on the daily chart to establish the higher-time-frame structure and initial bias. It then moves to a medium time frame, which the speaker defines as either the 4-hour or 1-hour chart. The same structure-mapping process is repeated as the analysis moves lower.
Summary & Key Takeaways
-
To effectively trade market structure, start by mapping out the structure from higher to lower time frames. This helps identify the overall trend direction and potential entry points. Focus on the present market conditions rather than past or future speculations to make informed decisions.
-
Understanding the concept of market shifts and liquidity sweeps is essential. Internal structure shifts indicate potential short-term changes in market direction, while liquidity sweeps can mislead traders into thinking a reversal has occurred. Patience is crucial in waiting for the market to reveal its direction.
-
A systematic approach is necessary to narrow down trading ranges and focus areas. By identifying the trading range and potential points of interest, traders can make more informed decisions and avoid getting trapped in false moves or distractions outside the defined range.
Read in Other Languages (beta)
Share This Summary 📚
Summarize YouTube Videos and Get Video Transcripts with 1-Click
Try YouTube Summary with ChatGPT & Claude or YouTube Transcript Generator
Explore More Summaries from The Trading Geek 📚






Summarize YouTube Videos and Get Video Transcripts with 1-Click
Try YouTube Summary with ChatGPT & Claude or YouTube Transcript Generator