How to Scalp with Supply and Demand Zones
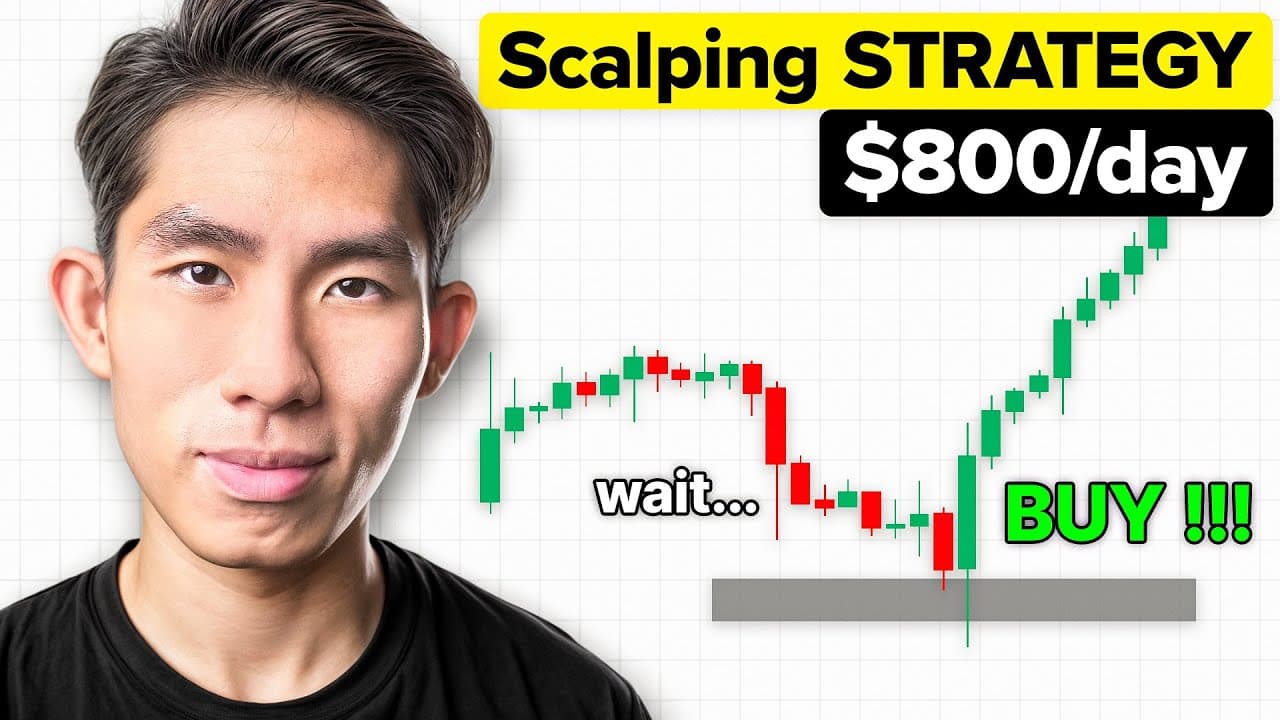
TL;DR
Mark supply and demand zones, then wait for candlestick confirmation before entering a scalp. A long upper wick at supply can signal selling pressure, while a long lower wick at demand can signal buying pressure. Place the stop beyond the zone, target the next opposite zone, and seek at least a 1:3 risk-to-reward ratio when the chart allows it.
Transcript
I want to share with you the three High win rate sculping strategies that will get you to making your first 10K per month and if you have a small trading account these strategies should be perfect for you the first step is to identify your supply and demand zones and you can do that by identifying any one of these four types of supply and demand zo... Read More
Key Insights
- Supply and demand analysis begins with four structures: rally-base-drop, drop-base-drop, drop-base-rally, and rally-base-rally. The rally and drop describe directional price movement, while the base represents consolidation before either a reversal or continuation.
- A rally-base-drop structure is a reversal supply zone where price rises, consolidates, and turns downward. A drop-base-drop structure is a continuation supply zone where a decline pauses in consolidation before price resumes moving lower.
- A drop-base-rally structure is a reversal demand zone where price falls, consolidates, and then moves upward. A rally-base-rally structure is a continuation demand zone where an advance pauses before price continues rising.
- A long upper wick at a supply zone is presented as evidence of rejection. Buyers pushed price upward, but sellers entered strongly enough to force it back down before the candle closed, indicating potential selling pressure.
- A long lower wick at a demand zone is presented as evidence of buying pressure. Sellers pushed price below the zone, but buyers prevented the breakdown and drove price upward before the candle closed.
- A faster entry occurs immediately after a long-wick rejection candle forms at the relevant zone. The approach may capture a better entry price, but it relies on the first visible sign of changing momentum rather than additional confirmation.
- A safer entry waits for the next several candlesticks to confirm that momentum has shifted. Red candles after rejection at supply can support a sell decision, while a solid green candle after rejection at demand can support a buy decision.
- Risk management uses a stop beyond the supply or demand zone and a target at the next opposite zone. The recommended minimum is a 1:3 risk-to-reward ratio, and a late entry should be avoided when the remaining reward no longer justifies the stop distance.
Install to Summarize YouTube Videos and Get Transcripts
Explore YouTube Video Summarizer or Get YouTube Transcript Extractor
Questions & Answers
Q: How do you identify supply and demand zones for scalping?
Identify zones by finding one of four price structures around a consolidation base. Rally-base-drop and drop-base-drop create supply zones, while drop-base-rally and rally-base-rally create demand zones. The reversal structures change direction after the base, whereas the continuation structures resume the prior direction. Mark these areas before waiting for price to return and produce confirming price action.
Q: What does a long upper wick mean at a supply zone?
A long upper wick at a supply zone means buyers pushed price upward during the candle, but sellers entered and forced it back down before the close. The rejection is treated as the first sign that selling pressure may be overtaking buying momentum. A trader can enter immediately for a faster sell entry or wait for later bearish candles to provide confirmation.
Q: What does a long lower wick mean at a demand zone?
A long lower wick at a demand zone means sellers attempted to drive price beneath the area, but buyers entered and pushed it back upward before the candle closed. The recovery is interpreted as an early sign of buying momentum. A buy can be considered after that rejection, with the stop below the demand zone and the target near the next supply zone.
Q: How can beginners confirm a scalping entry more safely?
Beginners can wait for several candles after the initial rejection instead of entering immediately. At supply, indecision followed by red bearish candles can show that sellers are gaining control. At demand, a green candle with a clear body can show that buyers are entering. This confirmation reduces reliance on one candle, although waiting may produce a later entry.
Q: Where should a stop loss be placed in this strategy?
For a sell entered at a supply zone, the stop loss is placed above the key supply area. For a buy entered at a demand zone, it is placed below the demand area. This positioning uses the zone as the point that should contain price if the rejection remains valid, while the next opposite zone provides a possible profit target.
Q: Where should take profit be set for a supply or demand trade?
Take profit is placed at the next opposite zone. A sell from supply targets a demand zone below, while a buy from demand targets a supply zone above. The target should also support an acceptable risk-to-reward relationship. If confirmation arrives so late that the remaining distance to the target is small, the trade may no longer be worth entering.
Q: What risk-to-reward ratio does the scalping method recommend?
The method recommends seeking at least a 1:3 risk-to-reward ratio. The transcript explains that this relationship allows one winning trade to offset three losing trades and reach break-even, assuming each loss and gain follows the planned amounts. The ratio should be checked before entry because delayed confirmation can increase the stop distance relative to the remaining profit opportunity.
Q: When should a trader skip a confirmed scalping setup?
A trader should skip the setup when confirmation comes too late and creates an unattractive relationship between the stop and target. If a sell entry occurs far below the supply zone, the stop may still need to sit above that zone while the next demand target is already close. In that situation, the available reward may not justify the required risk.
Summary & Key Takeaways
-
The method begins by identifying four supply and demand patterns: rally-base-drop, drop-base-drop, drop-base-rally, and rally-base-rally. Reversal zones suggest price may change direction after consolidation, while continuation zones suggest the existing move may resume after consolidation. These marked areas provide the context for evaluating potential entries.
-
The momentum candlestick strategy waits for price to revisit a marked zone and show rejection. At supply, a long upper wick indicates that buyers pushed higher before sellers forced price back down. At demand, a long lower wick indicates that sellers pushed lower before buyers recovered control and lifted the close.
-
Entries can be taken immediately after a rejection candle or delayed until subsequent candles confirm a momentum shift. Stops are placed beyond the relevant zone, and profit targets are set near the next opposite zone. Trades should be skipped when delayed confirmation leaves insufficient reward relative to the required stop distance.
Read in Other Languages (beta)
Share This Summary 📚
Summarize YouTube Videos and Get Video Transcripts with 1-Click
Try YouTube Summary with ChatGPT & Claude or YouTube Transcript Generator
Explore More Summaries from The Trading Geek 📚






Summarize YouTube Videos and Get Video Transcripts with 1-Click
Try YouTube Summary with ChatGPT & Claude or YouTube Transcript Generator