How to Read Price Action With Japanese Candlesticks

TL;DR
Price action reads market intent through Japanese candlesticks, focusing on strong candles and long wicks at key zones. A marubozu closes with no wick at top or bottom and signals strong buying or selling momentum, while a candle that engulfs the last three or four candles counts as a big candle. Long wicks at support or resistance confirm rejection, and break-and-retest is the core continuation setup.
Transcript
in the markets to make money you have to learn how to speak the language you have to understand the signals that it's giving you whether it's going to go up or whether it's going to go down and this for most of us that are experienced in the market it's actually very easy you just simply read the language and it's pretty much obvious what the marke... Read More
Key Insights
- Price action is described as the language the market uses to make its intentions clear through candlesticks or lines on a screen, indicating whether price will move strongly up, strongly down, or not move at all.
- Japanese candlesticks are the language roughly 90% of traders read, according to the speaker, who has used them for about 6 years. Each candle carries a high, low, open, and close, and reading them correctly lets you anticipate what happens next.
- A marubozu is a candlestick that closes with no wick at the top and no wick at the bottom. Price opens, shoots in one direction, and closes there, showing continued momentum and a strong indication that buyers or sellers have taken control.
- A strong marubozu usually eats up the last one or two candlesticks, making it a bullish or bearish engulfing candle at the same time. The speaker names engulfing candles as a personal favorite confirmation signal.
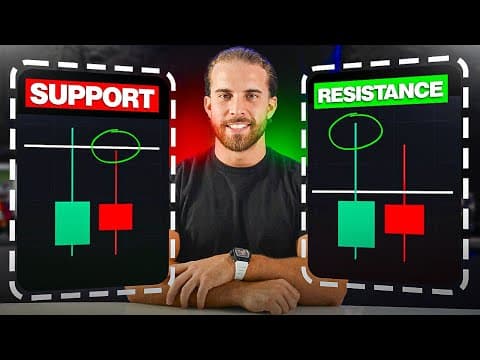
- Wicks, sometimes called spinning tops, shooting stars, or swords depending on the relative size of the top and bottom wick, confirm that price is rejecting a zone. They typically appear at strong support or strong resistance.
- The longer the wick, the stronger the rejection. A long lower wick means price fell to that point and buyers raised it all the way back up. A long upper wick means price reached the high and sellers drove it back down.
- A big candlestick is defined as one that eats up the last three or four candlesticks. On the hourly time frame, one candle engulfing three means a single hour outdid three hours of work, which the speaker treats as an entry confirmation.
- A normal candlestick might range roughly 20 to 15 pips, though this varies with market momentum and the zone. The practical method is comparing each candle to the ones before it and focusing only on the candles that stand out.
Install to Summarize YouTube Videos and Get Transcripts
Explore YouTube Video Summarizer or Get YouTube Transcript Extractor
Questions & Answers
Q: What is price action in trading?
Price action is the language the market uses to make its intentions clear through the candlesticks or lines shown on a computer screen. It tells you whether price is going to have a strong move up, a strong move down, or no move at all, including what happens when price retraces into an area of interest and either reacts and rejects from it or does not reject at all. The speaker has used price action for about 6 years and presents it as the best way to read what the market is telling you.
Q: What is a marubozu candlestick and what does it signal?
A marubozu is a candlestick that closes with no wick at the top and no wick at the bottom. From the moment price opened it simply shot up and then closed there, continuing the momentum of price. To the upside, this indicates that a lot of buyers are coming into the market and is a strong indication to buy. If the candlestick reverses and forms a strong marubozu to the downside, it is a strong confirmation that the market is now going to sell. A strong marubozu usually eats up the last one or two candlesticks, which also makes it a bullish or bearish engulfing candlestick.
Q: Why do long wicks matter in price action?
Wicks are confirmations in price action that price is rejecting certain zones, and they usually happen at a strong level of support or a strong level of resistance. The longer the wick, the better, because it means the rejection was stronger. A long lower wick means price went all the way down to that point and then buyers in the market raised price all the way back up, showing buyers are outdoing sellers. A long upper wick at resistance means price went all the way up to the high and then sellers came in and drove price all the way down. Multiple wicks strengthen the read.
Q: How big does a candlestick need to be to count as a strong signal?
A big candlestick is usually one that eats up the last three or four candlesticks. The speaker's reasoning is comparative: on the hourly time frame, if three candlesticks get completely engulfed by one candlestick, that single hour completely outdid the work of three hours, which is a strong confirmation. The speaker personally treats any candlestick that eats the last three candles as a strong candlestick, and this applies to both the upside and the downside. A normal candlestick might range anywhere from 20 to 15 pips, though this varies with market momentum and the zone.
Q: What candlestick reversal patterns does the video cover?
The reversal patterns named are the evening star formation and the head and shoulders at resistance, plus the morning star formation and the inverted head and shoulders at support. The evening star consists of a three pattern confirmation indicating that price is going to reverse. The head and shoulders appears on lower time frames most of the time but is more respected on the higher time frame, where it takes longer to play out. At a support level, the morning star signals a reversal to the upside, and the inverted head and shoulders signals a shift from a downward trend to an upward one.
Q: How does the break and retest strategy work?
Break and retest is described as the simplest continuation pattern out of the textbook and the key to the speaker's strategy, used every single week. It literally consists of a break and a retest: if you have a strong resistance level, you break it, retest it, and confirm. That is all that is needed. The critical requirement is waiting for the right confirmation to happen in the market, which means being extremely patient and making sure the move is not a fake out. The speaker says that used the right way it will work.
Q: Should you analyze every single candlestick on the chart?
No. After learning to interpret Japanese candlesticks, learning their language actually means not looking at every single wick or every single candlestick. You should only be looking at the markets when something big is going to happen, meaning a high probability trade setup. For those setups to occur, you need a strong area of interest or a zone where you are looking to enter a trade. A huge wick that price leaves randomly anywhere on the chart does not qualify. The rejections and wicks have to be happening at a strong zone you are already interested in.
Q: Why are Japanese candlesticks the standard for reading the market?
Every language has a way of expressing itself, the same way humans have English, Spanish, Japanese, French, and Italian, and the market has its own way of showing what it is trying to tell us. In the markets the speaker has traded for 6 years, and for roughly 90% of the rest of the traders, that language is Japanese candlesticks. These candlesticks contain a lot of information: a high point, a low point, an open price, and a close price, and they vary in body size and wick size. Reading them the right way lets you anticipate what is going to happen next.
Summary & Key Takeaways
-
Price action is presented as the language the market speaks, delivered through Japanese candlesticks. Just as humans use English, Spanish, Japanese, French, or Italian, the market expresses intent through candle shapes. The speaker has traded this way for about 6 years and says roughly 90% of traders read the same candlestick language to anticipate strong moves up, strong moves down, or no move at all.
-
Two candle types carry most of the weight. Marubozu candles close with no wick on either end, showing that buyers or sellers ran price in one direction without giving anything back, and they often engulf the previous one or two candles. Long wicks do the opposite job: they mark rejection at a strong support or resistance level, and the longer the wick, the stronger the rejection.
-
Patterns add a further layer. Reversal patterns include the evening star, a three-candle formation, the head and shoulders seen mostly on lower time frames but more respected on higher ones, plus the morning star and inverted head and shoulders at support. The main continuation pattern is break and retest, which the speaker calls the key to their strategy and uses every week.
-
Reading the language does not mean watching every wick or every candle. The speaker advises looking at the markets only when a high probability setup is forming, which requires a strong area of interest or zone. A large wick left randomly in the middle of the chart does not count. Patience matters most for avoiding fake breakouts on retests.
Read in Other Languages (beta)
Share This Summary 📚
Summarize YouTube Videos and Get Video Transcripts with 1-Click
Try YouTube Summary with ChatGPT & Claude or YouTube Transcript Generator
Explore More Summaries from fxalexg 📚




Summarize YouTube Videos and Get Video Transcripts with 1-Click
Try YouTube Summary with ChatGPT & Claude or YouTube Transcript Generator